The TheDuffman85/crowdsec-web-ui project has been moving fast. If you read my hub-and-spoke CrowdSec post you already know I run this UI on GateKeeper for local visibility. What I did not cover there is that the project recently shipped native dashboard authentication: password login, passkeys, and OIDC SSO.
That last one is the interesting part. You can now point it directly at Authentik, Authelia, Keycloak, or whatever you run, and it handles the full OIDC flow itself without any forward auth proxy in front of it.
No more “throw Authentik’s proxy provider in front of it and hope.” This is a real OIDC client built into the app.
Here is how I set it up in my lab using Authentik.
What Changed
Older versions of crowdsec-web-ui had no authentication at all. The README used to say to protect it with a reverse proxy IdP. That is still valid advice for defense in depth, but native auth is now available and the OIDC integration works cleanly.
The new auth layer lives entirely in the app. The SQLite database at /app/data/crowdsec.db stores your users, passkeys, OIDC config, notification settings, and table preferences. That single detail matters more than it sounds. If you do not mount that path as a volume, every redeploy wipes your config. More on that in a minute.
New installs start with auth enabled by default and drop you into a setup wizard on first load.
Authentik: Create the OAuth2/OpenID Provider
In Authentik: Admin > Applications > Providers > Create
- Type: OAuth2/OpenID Provider
- Name:
crowdsec-web-ui - Authorization flow:
default-provider-authorization-implicit-consent - Client type: Confidential
- Client ID: auto-generated, copy this
- Client Secret: auto-generated, copy this
- Redirect URIs:
https://crowdsec.lab.example.cloud/api/auth/oidc/callback - Signing Key:
authentik Self-signed Certificate
Under Advanced Protocol Settings, make sure openid, profile, email, and groups are all in the selected scopes. The groups scope is what makes group-based role mapping work on the crowdsec-web-ui side.
On the last page of the wizard you will be asked for an Encryption Key and a Subject Mode. Leave the Encryption Key blank and keep the default Subject Mode (hashed ID). Then hit Create.
Authentik: Create the Application
Admin > Applications > Applications > Create
- Name:
CrowdSec Web UI - Slug:
crowdsec-web-ui - Provider: the one you just created
- Launch URL:
https://crowdsec.lab.example.cloud
Bind a group in the Policy/Group/User Bindings tab if you want to restrict who can even attempt to authenticate. This is separate from the role mapping inside crowdsec-web-ui itself.
Once the application is saved, go back to the provider detail page. The Client ID, Client Secret, and the auto-generated issuer URL are all visible there. That is where you grab the values you will need on the crowdsec-web-ui Settings page.
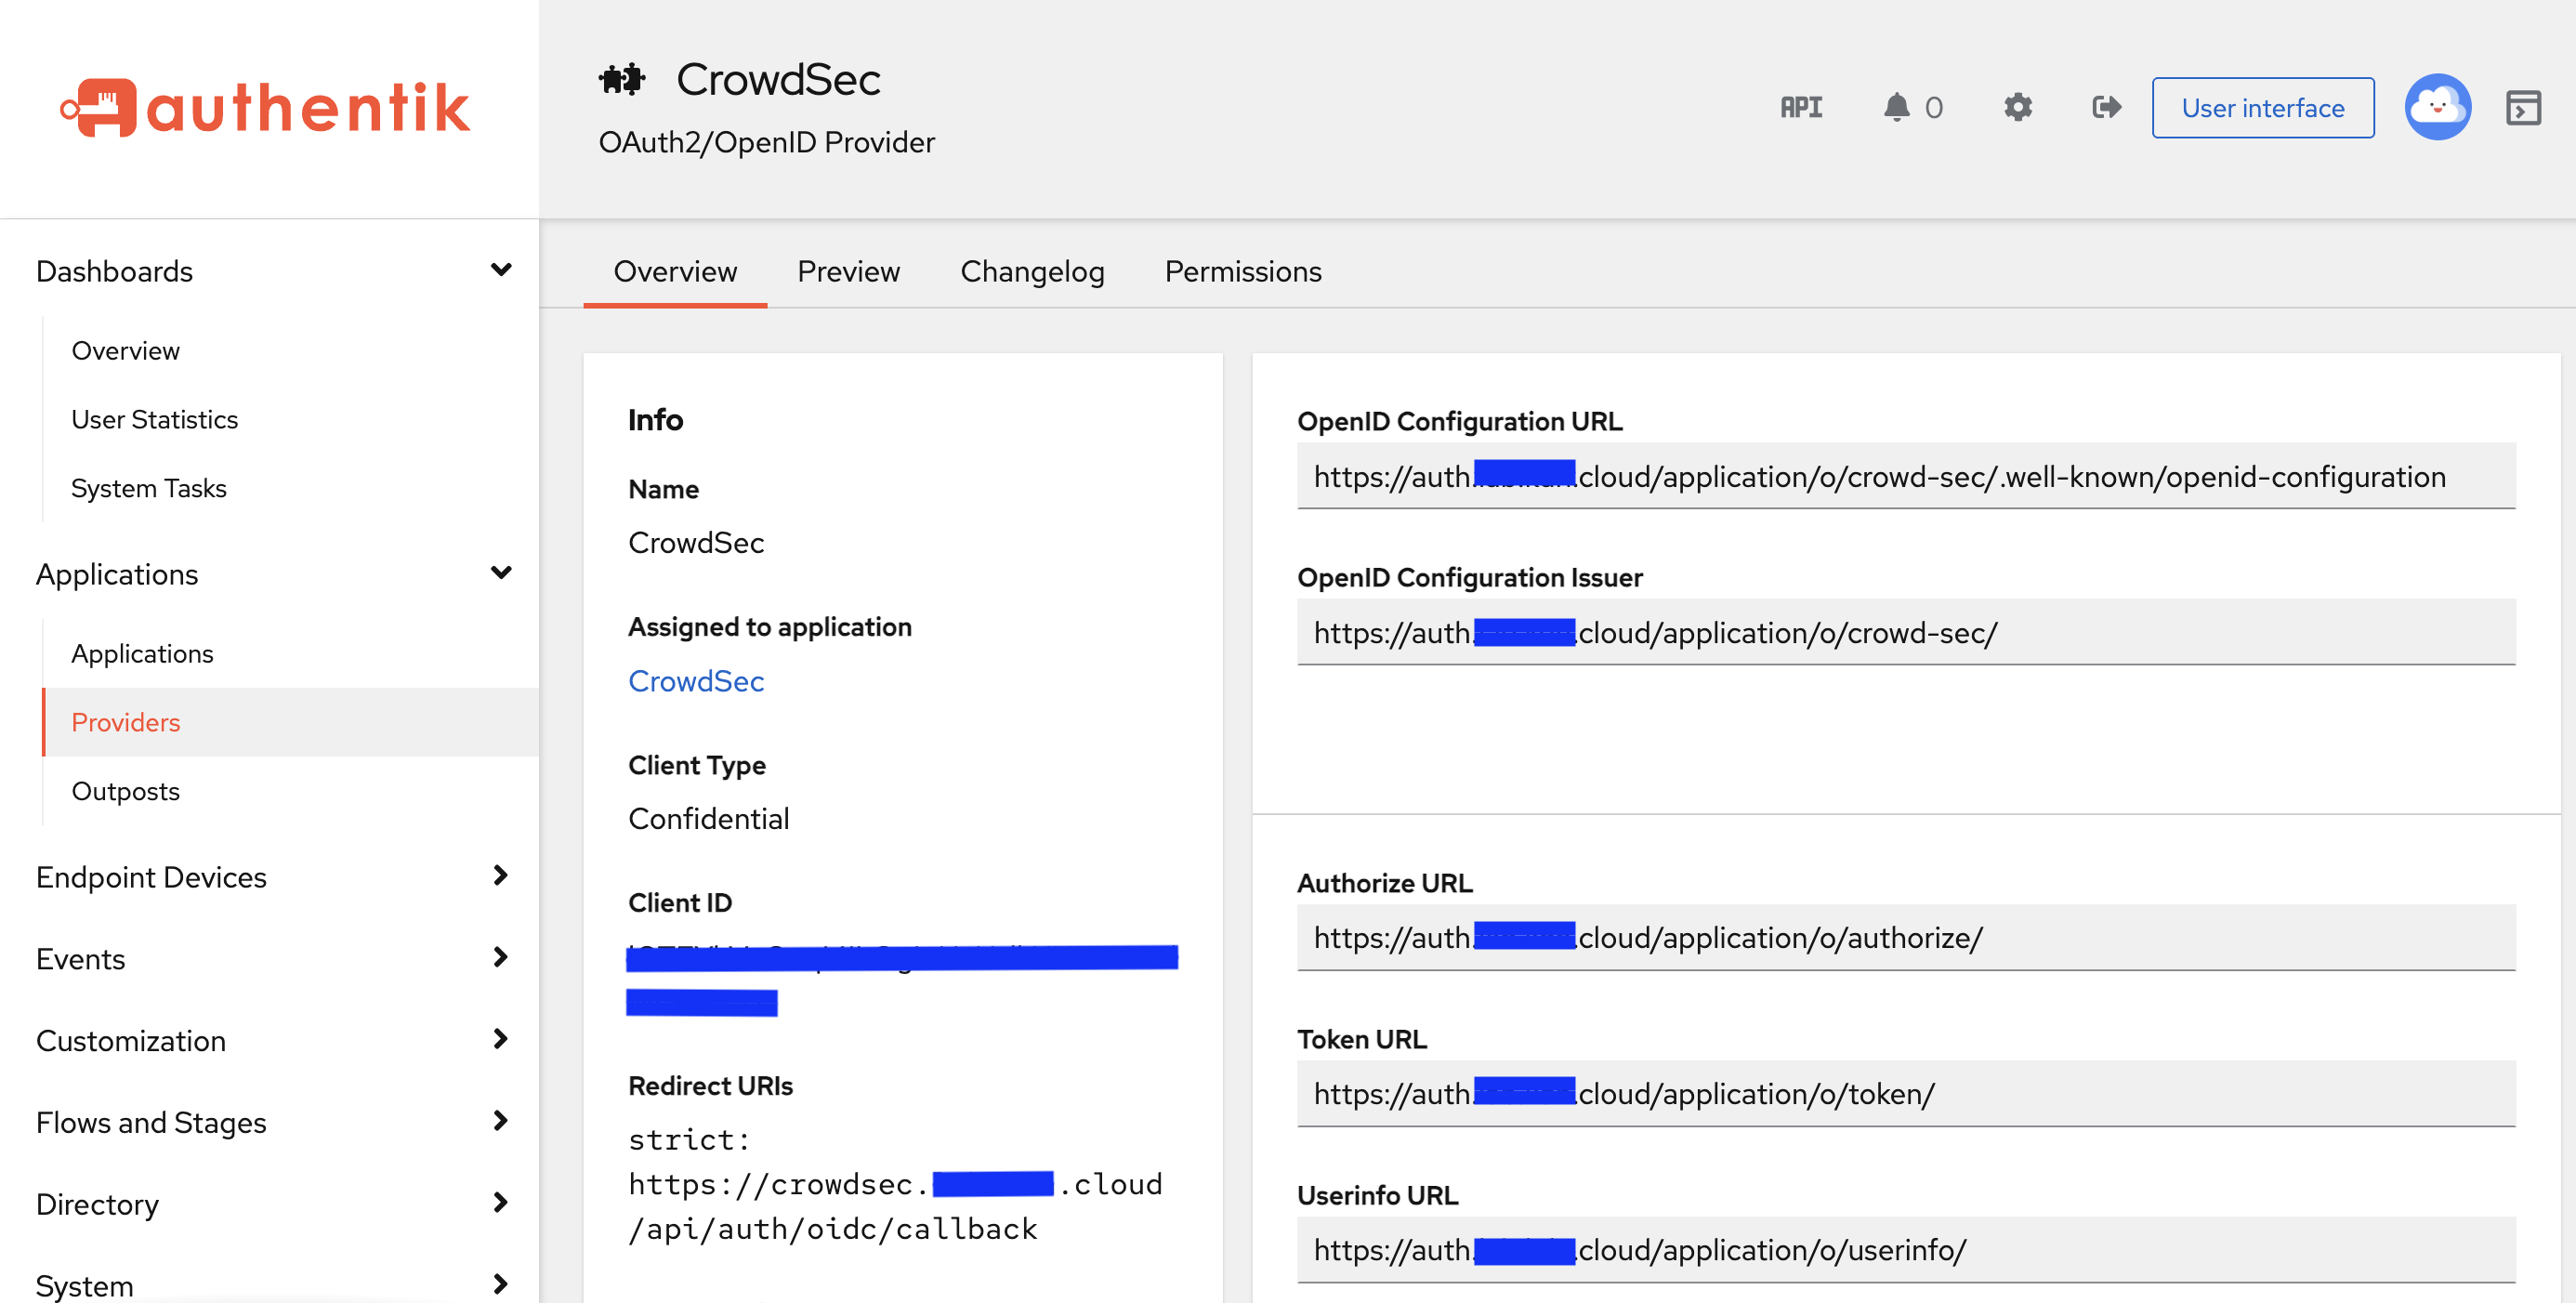
Authentik: Confirm Your Issuer URL
Your OIDC issuer URL is built from the application slug you set above:
https://auth.lab.example.cloud/application/o/crowdsec-web-ui/
The trailing slash is required. The app fetches /.well-known/openid-configuration from this URL to discover endpoints automatically. You can sanity check it in a browser before you touch any config:
https://auth.lab.example.cloud/application/o/crowdsec-web-ui/.well-known/openid-configuration
If that returns a JSON blob with authorization_endpoint, token_endpoint, and jwks_uri, you are good.
Update Your Compose Stack
Here is the full updated service block. The key addition is CROWDSEC_PROMETHEUS_URL, plus the volume mount that keeps your data alive across redeploys.
  crowdsec-ui:
    image: ghcr.io/theduffman85/crowdsec-web-ui:latest
    container_name: crowdsec-ui
    restart: unless-stopped
    environment:
      # CrowdSec LAPI
      - CROWDSEC_URL=http://crowdsec:8888
      - CROWDSEC_USER=crowdsec-ui
      - CROWDSEC_PASSWORD=your-password-here

      # AUTH_ENABLED=true is the default for new installs — only needed
      # if migrating from an older version that predates dashboard auth
      # - AUTH_ENABLED=true

      # Prometheus metrics (optional but worth enabling)
      - CROWDSEC_PROMETHEUS_URL=http://crowdsec:6060/metrics

    ports:
      - "8181:3000"
    volumes:
      - /home/user/crowdsec/crowdsec-ui:/app/data
    networks:
      - crowdsec_net
    depends_on:
      - crowdsec

networks:
  crowdsec_net:
    driver: bridge
Notice I am not setting the OIDC vars in the compose file. The Settings UI handles them and the database-saved values take precedence over env vars anyway. Pick one place and stick to it. I configure OIDC through the UI.
Create the data directory before you bring the stack up:
mkdir -p /home/user/crowdsec/crowdsec-ui
The Volume Mount Matters More Than You Think
This is the thing that will silently wreck you if you skip it.
The older versions of crowdsec-web-ui were stateless. Every request hit the LAPI directly, nothing was stored locally, and it did not matter whether the container started fresh. That is no longer true.
The new version stores everything locally:
- alert and decision cache
- auth users and passkeys
- OIDC settings
- notification rules and destinations
- table column preferences
All of it lives in /app/data inside the container. Without a volume mount, every docker compose down && up cycle wipes it. You will re-create your admin account, re-enter your OIDC config, and re-wire your notification rules every single time.
Also: do not mount this into your main CrowdSec data/ directory. That directory belongs to the CrowdSec Security Engine and already has its own crowdsec.db in it. Give the web UI its own dedicated directory.
First Login and Configuring OIDC
Bring the stack up:
docker compose up -d crowdsec-ui
Hit the UI in the browser. Because this is a new install, auth is enabled by default and you will land on a setup page to create the first local administrator account. Go through it. This local account is your break-glass fallback. Keep it.
Once you are logged in, go to Settings and scroll down to the OIDC (SSO) section.
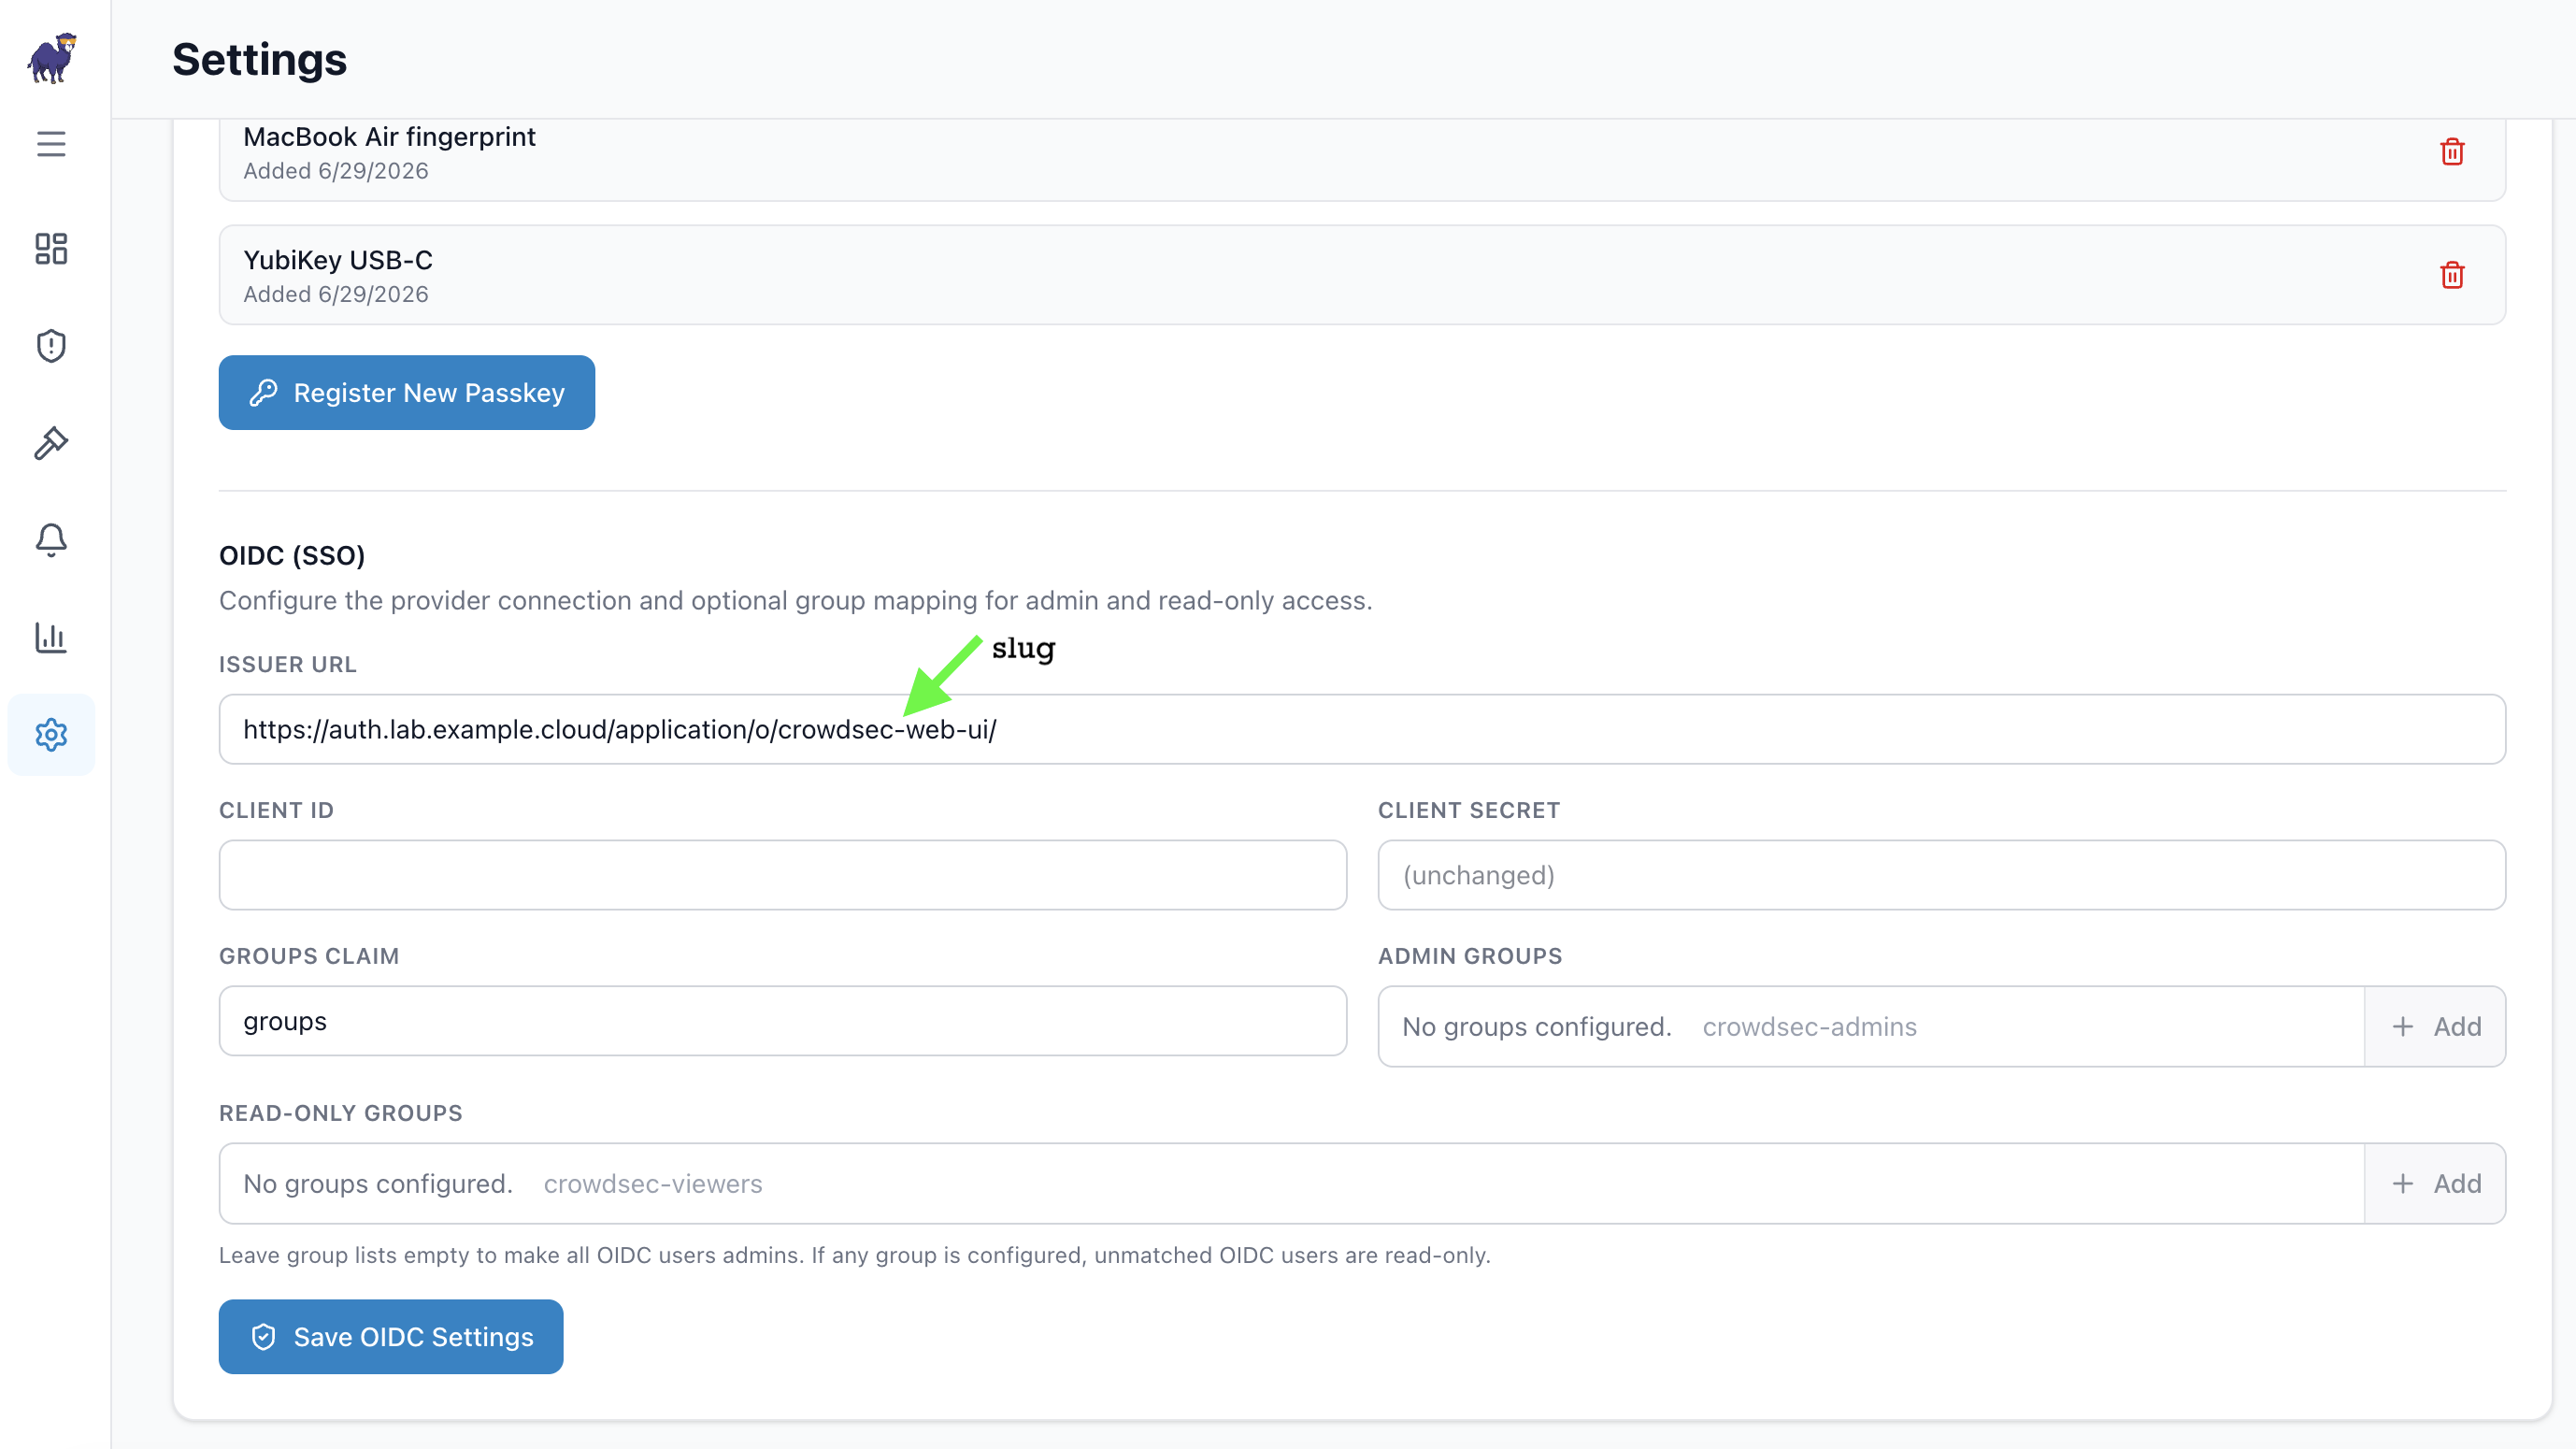
Fill in:
- Issuer URL:
https://auth.lab.example.cloud/application/o/crowdsec-web-ui/ - Client ID: from the Authentik provider detail page
- Client Secret: from the Authentik provider detail page
- Groups Claim:
groups - Admin Groups: whatever Authentik group should have admin access
- Read-Only Groups: leave empty unless you want a viewer role
Hit Save OIDC Settings.
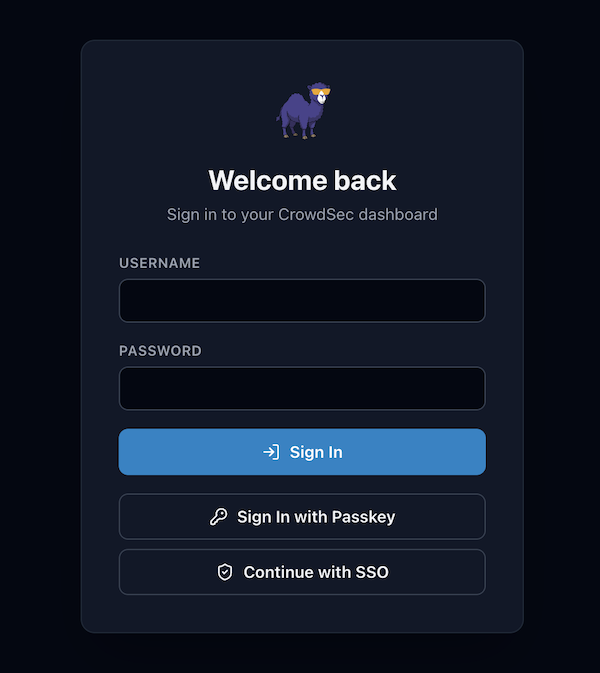
Log out and hit the login page again. You should now see an SSO option alongside the password form. Click it and the OIDC flow kicks off against Authentik.
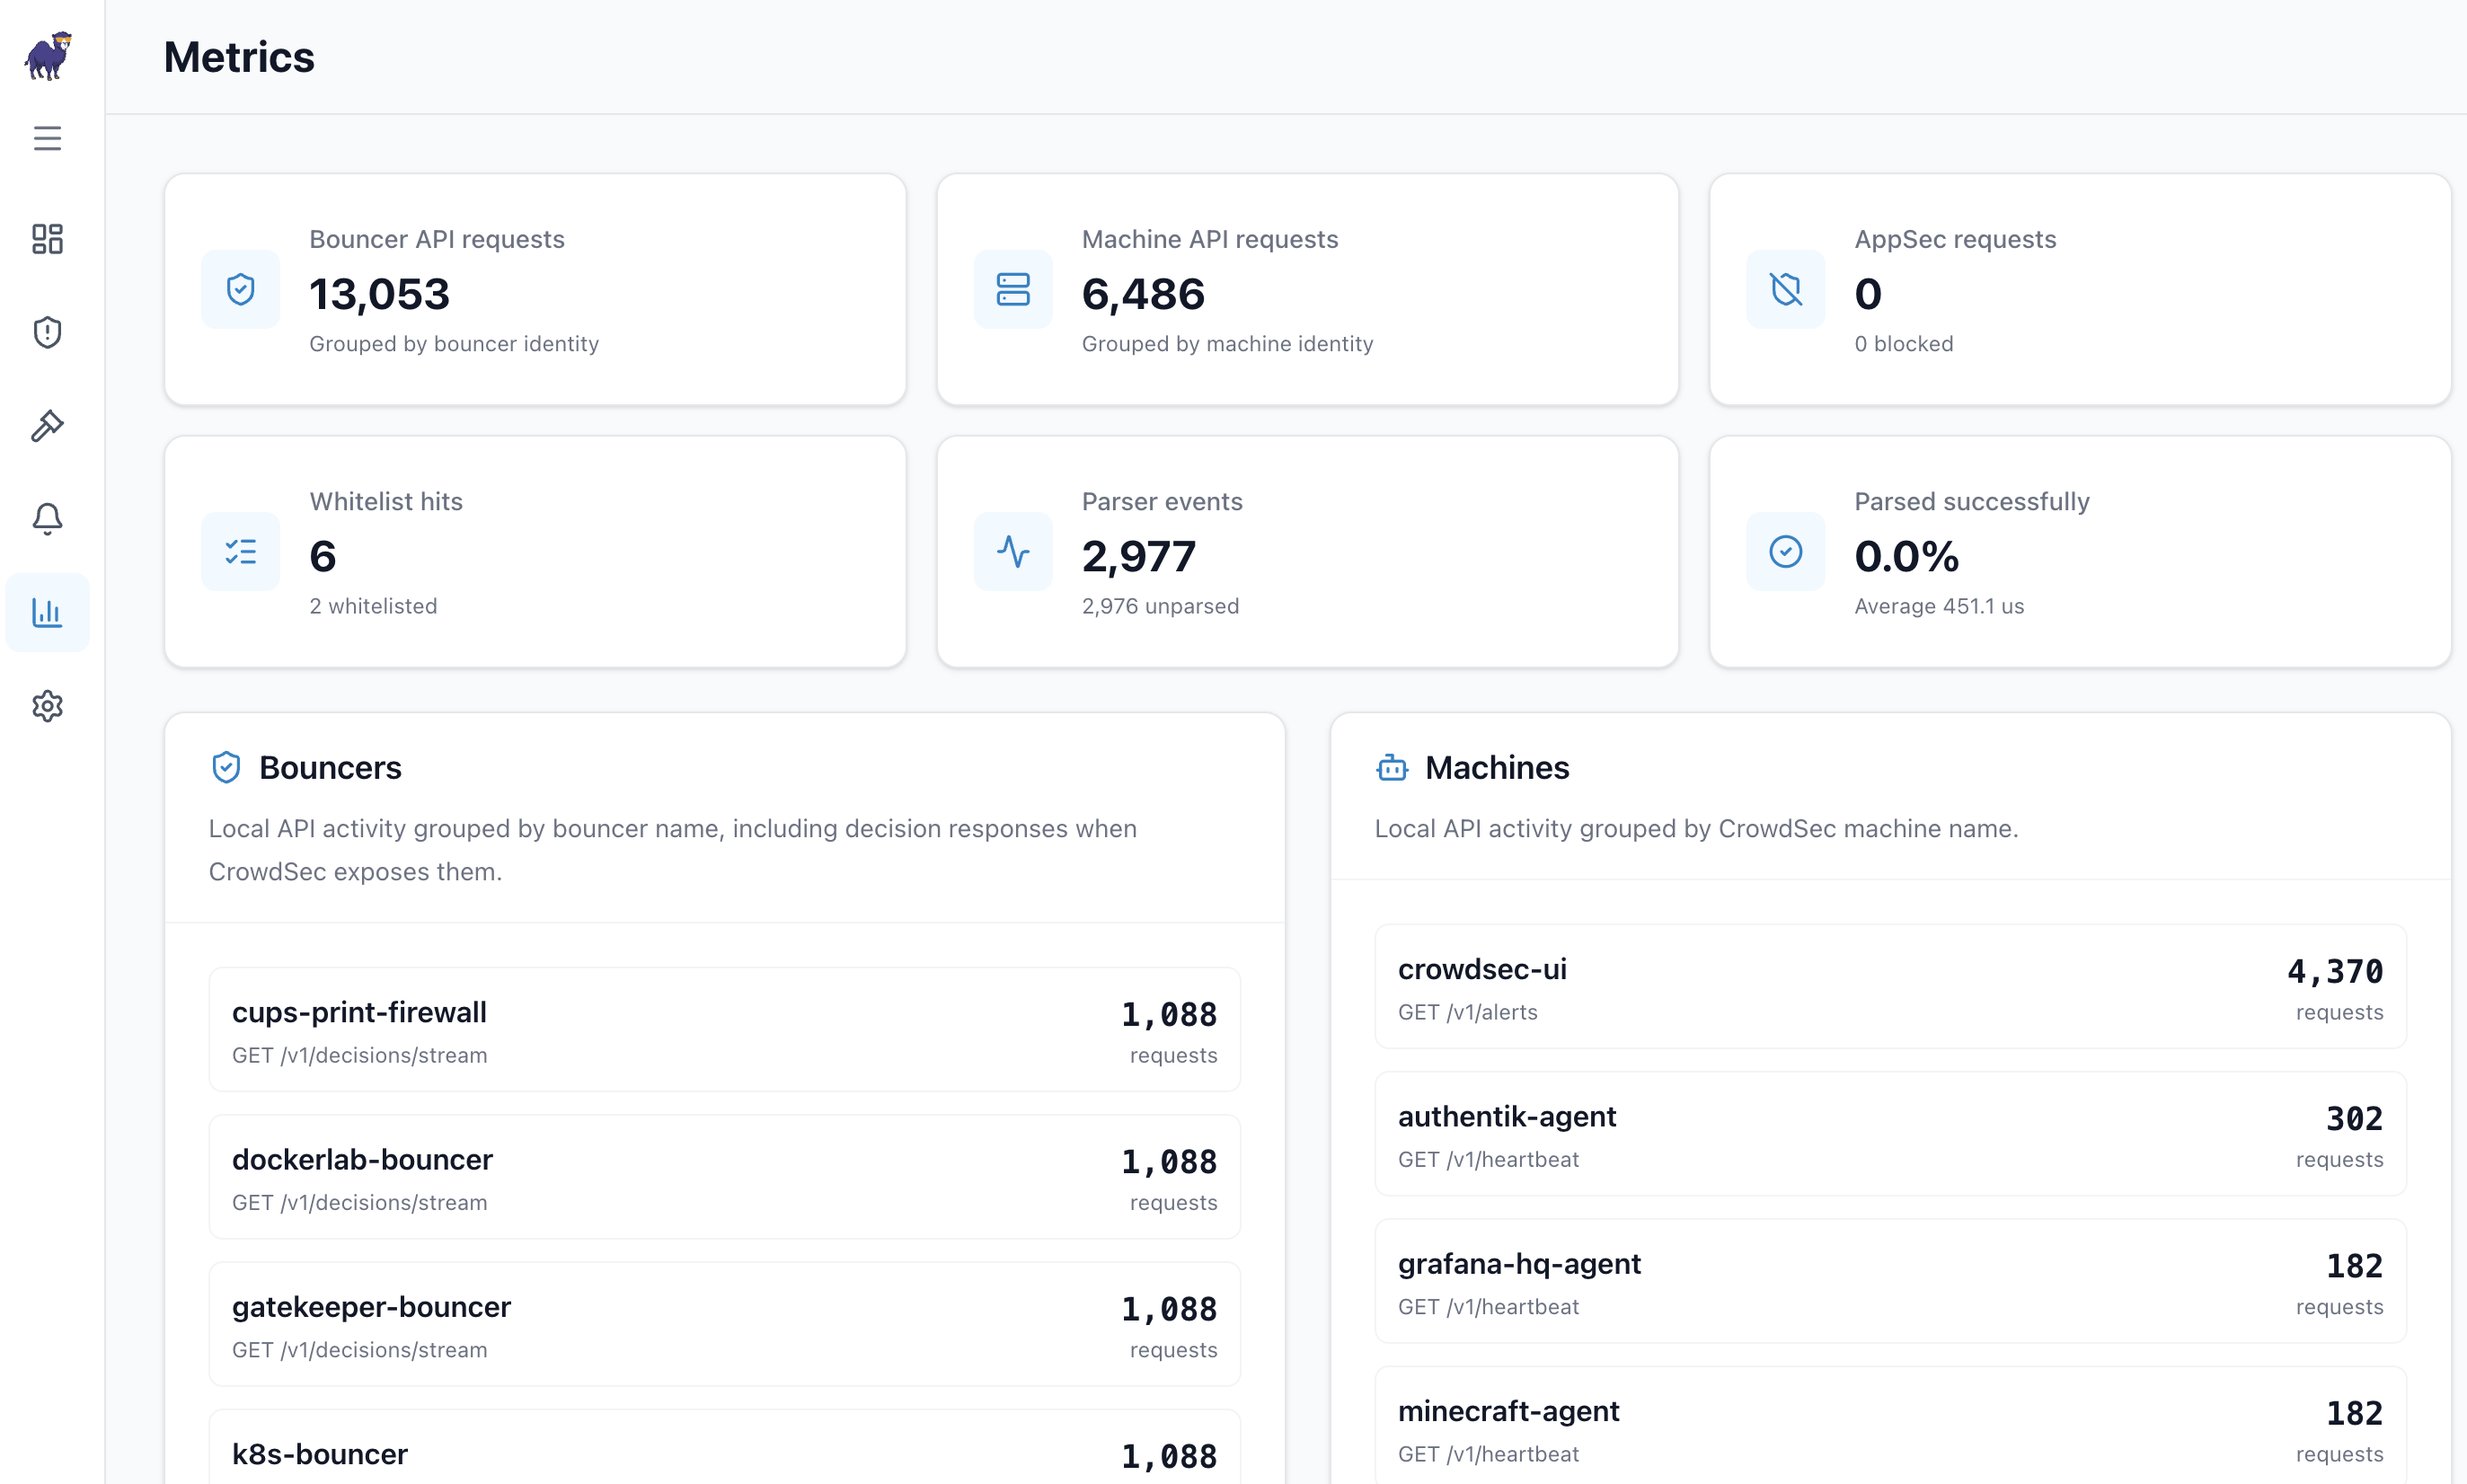
Enabling Prometheus Metrics
The Metrics page in the web UI will show a setup prompt until you wire everything together. There are three pieces to this: the CrowdSec LAPI config on the host, the env var in the container, and the Prometheus scrape job if you are also feeding Grafana.
1. Enable Prometheus on the LAPI Host
On your LAPI host, open /etc/crowdsec/config.yaml and make sure the Prometheus block looks like this:
prometheus:
  enabled: true
  level: full
  listen_addr: 0.0.0.0
  listen_port: 6060
level: full is required to get the detailed bouncer, machine, AppSec, parser, and whitelist metrics that the web UI Metrics page is actually looking for. level: aggregated will work but shows less. level: none disables metrics registration entirely.
listen_addr: 0.0.0.0 is necessary when the web UI and CrowdSec run in separate containers, which they do in this setup. It makes the endpoint reachable over the Docker network. Keep port 6060 bound to trusted networks only and do not expose it publicly.
Restart CrowdSec after making the change:
docker compose restart crowdsec
Verify the endpoint is up before moving on:
curl http://192.168.70.84:6060/metrics | head -20
You should see lines like cs_lapi_bouncer_requests_total and cs_lapi_machine_requests_total. If the endpoint is not responding, check that port 6060 is published in your CrowdSec service compose definition.
# TYPE cs_active_decisions gauge
cs_active_decisions{action="ban",origin="CAPI",reason="http:scan"} 34224
cs_active_decisions{action="ban",origin="lists",reason="firehol_greensnow"} 5900
cs_active_decisions{action="ban",origin="lists",reason="otx-webscanners"} 2590
cs_active_decisions{action="ban",origin="lists",reason="tor-exit-nodes"} 2156
# HELP cs_alerts Number of alerts (excluding CAPI).
# TYPE cs_alerts gauge
cs_alerts{reason="crowdsecurity/http-bad-user-agent"} 1
# HELP cs_filesource_hits_total Total lines that were read.
# TYPE cs_filesource_hits_total counter
cs_filesource_hits_total{acquis_type="syslog",datasource_type="file",source="/var/log/auth.log"} 2888
cs_filesource_hits_total{acquis_type="syslog",datasource_type="file",source="/var/log/crowdsec-fleet.log"} 246
cs_filesource_hits_total{acquis_type="syslog",datasource_type="file",source="/var/log/syslog"} 626
# HELP cs_info Information about Crowdsec.
# TYPE cs_info gauge
cs_info{version="v1.7.8-63227459"} 0
# HELP cs_lapi_bouncer_requests_total Number of calls to each route per method grouped by bouncers.
# TYPE cs_lapi_bouncer_requests_total counter
cs_lapi_bouncer_requests_total{bouncer="authentik-bouncer",method="GET",route="/v1/decisions/stream"} 1393
2. Add the Env Var to the Web UI Container
In the crowdsec-ui service environment block:
- CROWDSEC_PROMETHEUS_URL=http://crowdsec:6060/metrics
crowdsec here is the Docker service name, not the host IP. The web UI talks to the metrics endpoint directly over the internal Docker network. It does not go through your external Prometheus instance. This is only for the in-app Metrics page.
3. Add the Prometheus Scrape Job
If you are running Prometheus separately and want to scrape CrowdSec into Grafana, add a job to your prometheus.yml:
  # CrowdSec LAPI
  - job_name: 'crowdsec'
    scrape_interval: 30s
    metrics_path: /metrics
    static_configs:
      - targets: ['192.168.70.84:6060']
        labels:
          instance: 'gatekeeper-crowdsec'
          hostname: 'gatekeeper'
          os: 'linux'
          role: 'security-lapi'
          location: 'homelab-core'
          use: 'ids-ips'
Use the host IP here, not the Docker service name, since Prometheus runs outside the crowdsec Docker network. Reload Prometheus and check the targets page to confirm the job comes up healthy.
Once the LAPI config and the env var are both in place, the Metrics page populates on the next refresh cycle.
A Note on the README Versions
One thing worth knowing: the GitHub releases and the main branch README can be out of sync. The OIDC and auth features landed in the app before the release README caught up. If you pull the latest image and the README on the tagged release still says “this app has no built-in authentication,” that is why. Check main branch directly when in doubt.
Quick Reference
| Thing | Value |
|---|---|
| Authentik provider type | OAuth2/OpenID Provider |
| Redirect URI | https://your-domain/api/auth/oidc/callback |
| Issuer URL format | https://auth.example.cloud/application/o/<slug>/ |
| Trailing slash on issuer URL | Required |
| Groups claim | groups |
| Data volume | /app/data inside container |
| Prometheus endpoint (internal) | http://crowdsec:6060/metrics |
| Prometheus endpoint (external scrape) | http://<host-ip>:6060/metrics |
| CrowdSec metrics level | full |
| CrowdSec Auth | true by default — omit AUTH_ENABLED unless migrating an older install |
This is part of an ongoing series covering how I run CrowdSec across the KDN Lab fleet. Previous entries:
Comments
Questions, corrections, and follow-ups live in GitHub Discussions.