What you’re building: A production-grade centralized log management and SIEM stack running Graylog 7.x + OpenSearch + MongoDB inside Docker on a Proxmox VM, with fleet-wide rsyslog forwarding, GELF container logging, NFS-backed storage, and a reverse proxy entry point. By the end, every node in your lab ships logs to one place, and you’ll actually know what’s happening across your infrastructure for the first time.
I ran this lab blind for longer than I’d like to admit. Back in 2012 I had a VPS running Splunk Enterprise with a couple forwarders. Centralized logging was just part of the setup. When that VPS got sunset, I never replaced it. For years it was just Grafana dashboards for metrics and a lot of SSH-ing into nodes one at a time playing detective when something broke. When I finally stood up Graylog, I had 13 nodes reporting in within a few hours. The first thing I saw was a pfSense firewall block storm that had apparently been running for who knows how long. That alone was worth the setup time.
This guide covers every gotcha I hit: the MongoDB NFS crash loop, the Docker NAT source IP problem, the Graylog 7.x input activation trap that makes logs silently disappear, and the Proxmox-specific rsyslog situation nobody documents. Skip to what you need or follow it top to bottom.
Before you copy anything: I left my real lab patterns in here on purpose so the examples stay grounded. If you see
192.168.70.22, that is my Graylog host. If you see10.0.0.x,logs.domain.cloud, or a sample NFS path, swap those for whatever matches your environment.
Architecture Overview

My Debian and Ubuntu VPS nodes follow the same rsyslog pattern as the rest of the fleet. Boxes like nexus-node and herald forward *.* @@192.168.70.22:5140;RSYSLOG_SyslogProtocol23Format over a site-to-site WireGuard tunnel so Graylog can stay internal-only and still ingest remote system logs cleanly.
Why split storage? OpenSearch and Graylog journal data live on an NFS share from my UniFi UNAS Pro. These are high-volume paths, and I would rather let that storage array absorb the churn than burn up VM disk on the Graylog box. MongoDB holds only Graylog’s configuration (dashboards, inputs, stream rules), not log data, so it stays on a local named volume. MongoDB has a documented incompatibility with NFS due to file locking. Don’t fight it.
Prerequisites
- Proxmox host with a spare VM slot
- A modern x86_64 Linux guest for the Graylog VM
- Ubuntu 22.04 LTS, Ubuntu 24.04 LTS, Debian 12, or Debian 13 all work well here
- An NFS-capable storage target (UniFi UNAS Pro, TrueNAS, Synology, QNAP, etc.), optional but recommended for >1M logs/day
- Docker + Docker Compose v2 installed on the VM
- Nginx Proxy Manager or similar reverse proxy
- A wildcard or dedicated SSL cert for your lab domain
Step 1: Provision the Proxmox VM
I built this stack on Ubuntu 22.04, but there is nothing especially sacred about that release. Ubuntu 24.04 and modern Debian builds are fine too as long as Docker Compose runs cleanly and you give OpenSearch enough memory.
In the Proxmox UI, create a new VM with these baseline specs:
| Setting | Value |
|---|---|
| OS | Ubuntu 22.04/24.04 LTS or Debian 12/13 |
| CPU | 4–8 vCPU |
| RAM | 16GB minimum because OpenSearch is memory-hungry |
| Disk | 60–100GB (local SSD for OS + MongoDB) |
| Network | VirtIO NIC, assign a static IP |
Boot, install Ubuntu, set a static IP in /etc/netplan/, and install Docker:
# Install Docker
curl -fsSL https://get.docker.com | sh
sudo usermod -aG docker $USER
newgrp docker

# Verify
docker --version
docker compose version
Step 2: Set vm.max_map_count (Required for OpenSearch)
OpenSearch will silently fail or crash without this. Set it permanently:
echo "vm.max_map_count=262144" | sudo tee -a /etc/sysctl.conf
sudo sysctl -p

# Verify
cat /proc/sys/vm/max_map_count
# Should output: 262144
Production note: This is a kernel-level setting OpenSearch requires for its memory-mapped files. On a production system this lives in your Ansible
sysctlrole and gets applied at build time. It is not something you want to discover is missing after the fact.
Step 3: Mount NFS Storage (Optional but Recommended)
If you have an NFS-capable storage box, mount your Graylog share before the stack comes up. This pushes the heavy log data off the VM disk entirely. In my case, Graylog lands on a UniFi UNAS Pro export mounted locally at /mnt/unas/graylog.
Install NFS client:
sudo apt install -y nfs-common
Create the mount point:
sudo mkdir -p /mnt/unas/graylog
Add to /etc/fstab. Adjust the NFS export path for your own storage target:
# Graylog NFS share
10.0.0.x:/path/to/your/nfs/export  /mnt/unas/graylog  nfs  defaults,_netdev,rw,hard,intr,rsize=131072,wsize=131072,timeo=14  0  0
The server IP and export path here are placeholders. In my lab the actual export comes from a UniFi UNAS Pro, but your NFS server and shared path will match whatever storage platform you run.
Mount and pre-create subdirectories with correct ownership:
sudo mount -a

# OpenSearch runs as UID 1000
sudo mkdir -p /mnt/unas/graylog/{opensearch,journal,data}
sudo chown -R 1000:1000 /mnt/unas/graylog/

# Verify
df -h | grep graylog
ls -la /mnt/unas/graylog/
Why
_netdev? Tells systemd to wait for network availability before mounting. Without it, a reboot can race the network coming up and leave the NFS mount broken, which means OpenSearch won’t start.
Reality check: If you are following my exact pattern,
df -hwill show Graylog mounted from a UniFi UNAS Pro share into/mnt/unas/graylog. If your mount point or export path differs, that is expected. The important part is that OpenSearch and the Graylog journal land on healthy NFS storage while MongoDB stays local.
Step 4: Generate Credentials
Graylog needs two secrets. Generate them before writing your .env:
# GRAYLOG_PASSWORD_SECRET: random 96-char secret
openssl rand -hex 48

# GRAYLOG_ROOT_PASSWORD_SHA2: SHA256 of your admin password
echo -n 'YourAdminPassword' | sha256sum | awk '{print $1}'
Keep both values handy for the next step.
Step 5: Create the Docker Compose Stack
Create your stack directory:
mkdir -p /opt/stacks/graylog
cd /opt/stacks/graylog
.env
# Generate: openssl rand -hex 48
GRAYLOG_PASSWORD_SECRET=REPLACE_WITH_96_CHAR_SECRET

# Generate: echo -n 'yourpassword' | sha256sum | awk '{print $1}'
GRAYLOG_ROOT_PASSWORD_SHA2=REPLACE_WITH_SHA256_HASH

# Set a real value here. Do not leave this as changeme.
OPENSEARCH_INITIAL_ADMIN_PASSWORD=REPLACE_WITH_A_REAL_PASSWORD

# Must be the publicly reachable URI, used in Graylog email links
GRAYLOG_HTTP_EXTERNAL_URI=https://logs.domain.cloud/

TZ=America/Los_Angeles
GRAYLOG_HTTP_EXTERNAL_URI needs to match the real URL you will open in the browser. If this is wrong, links and some UI behavior get weird fast.
docker compose will automatically read a .env file from this directory, so keeping these values here stays clean and predictable.
docker-compose.yml
services:

  mongodb:
    image: mongo:7.0.37
    container_name: graylog-mongodb
    restart: unless-stopped
    networks:
      - graylog
    volumes:
      - mongodb-data:/data/db
      - mongodb-config:/data/configdb

  opensearch:
    image: opensearchproject/opensearch:2.19.0
    container_name: graylog-opensearch
    restart: unless-stopped
    environment:
      - cluster.name=graylog
      - node.name=opensearch
      - discovery.type=single-node
      - action.auto_create_index=false
      - plugins.security.ssl.http.enabled=false
      - plugins.security.disabled=true
      - bootstrap.memory_lock=true
      - OPENSEARCH_JAVA_OPTS=-Xms4g -Xmx4g
      - OPENSEARCH_INITIAL_ADMIN_PASSWORD=${OPENSEARCH_INITIAL_ADMIN_PASSWORD}
    ulimits:
      memlock:
        soft: -1
        hard: -1
      nofile:
        soft: 65536
        hard: 65536
    volumes:
      # NFS mount, OpenSearch data lives here
      - /mnt/unas/graylog/opensearch:/usr/share/opensearch/data
    networks:
      - graylog
    ports:
      - "9200:9200"

  graylog:
    image: graylog/graylog:7.0.6
    container_name: graylog
    hostname: graylog
    restart: unless-stopped
    depends_on:
      - mongodb
      - opensearch
    entrypoint: /usr/bin/tini -- wait-for-it opensearch:9200 -- /docker-entrypoint.sh
    environment:
      - GRAYLOG_PROMETHEUS_EXPORTER_ENABLED=true
      - GRAYLOG_PROMETHEUS_EXPORTER_BIND_ADDRESS=0.0.0.0:9833
      - TZ=${TZ}
      - GRAYLOG_PASSWORD_SECRET=${GRAYLOG_PASSWORD_SECRET}
      - GRAYLOG_ROOT_PASSWORD_SHA2=${GRAYLOG_ROOT_PASSWORD_SHA2}
      - GRAYLOG_HTTP_EXTERNAL_URI=${GRAYLOG_HTTP_EXTERNAL_URI}
      - GRAYLOG_ELASTICSEARCH_HOSTS=http://opensearch:9200
      - GRAYLOG_MONGODB_URI=mongodb://mongodb:27017/graylog
      - GRAYLOG_ROOT_TIMEZONE=America/Los_Angeles
      - GRAYLOG_NODE_ID_FILE=/usr/share/graylog/data/config/node-id
    ports:
      - "9000:9000"       # Web UI
      - "9833:9833"       # Prometheus metrics
      - "5140:5140/tcp"   # Syslog TCP (preserves source IPs through Docker NAT)
      - "5140:5140/udp"   # Syslog UDP
      - "12201:12201/tcp" # GELF TCP, if you want it
      - "12201:12201/udp" # GELF UDP
      - "5044:5044/tcp"   # Beats input, optional
    volumes:
      - /mnt/unas/graylog/graylog:/usr/share/graylog/data
    networks:
      - graylog

volumes:
  mongodb-data:
    driver: local
  mongodb-config:
    driver: local

networks:
  graylog:
    driver: bridge
    ipam:
      config:
        - subnet: 192.168.205.0/24
Why MongoDB uses local named volumes and not NFS: MongoDB’s entrypoint tries to
chownits data directories at startup. NFS blocks this due to root squashing, causing a crash loop. MongoDB only holds Graylog’s config metadata, not log data, so local storage is fine and avoids the locking issue entirely.
Why TCP for syslog, not UDP? When Docker NATs traffic through the bridge network, UDP packets lose their source IP. Every log entry looks like it came from the Docker host. Using TCP (
@@in rsyslog) preserves the real originating source IP in Graylog. This one will drive you crazy if you miss it.
Version note: The compose file here reflects what I actually run now: Graylog
7.0.6, OpenSearch2.19.0, and MongoDB7.0.37. I pin all three on purpose. Graylog’s compatibility matrix may say newer combinations are supported, but I still do not let this stack float.
A note on Graylog
7.1.3as of June 2026: I upgraded to7.1.3during the writing of this guide and immediately regretted it. In my lab, Graylog7.1.xstarted making UI calls to Enterprise content stream API endpoints that do not exist in the free open source build. The result was a wall of HTTP400errors on page load, dashboards that stopped behaving, search that became flaky, and enoughCould not load content streamnoise to make the UI functionally broken. It even behaved differently in an incognito window because the normal browser session was carrying the cached mess around like a souvenir.
When I downgraded back to
7.0.6, Graylog would not start cleanly until I fixed the MongoDB sessions index that7.1.3had changed. The command that got me out of the ditch was:db.sessions.dropIndex("session_id_1")After that,
7.0.6booted cleanly and rebuilt the index the way it expects. So for now,7.0.6is the safe pinned version in this guide. I am not moving back to7.1.xuntil I can verify the content stream issue is actually fixed and the MongoDB session schema stops playing games during downgrade.
Why the
wait-for-itentrypoint is there: Graylog likes to come up fast and then complain if OpenSearch is not actually answering yet. Lettingtiniwait foropensearch:9200saves you from a noisy cold-start race.
About the extra ports: I expose
9200,12201/tcp, and5044/tcpinside the lab so I have room for direct checks and future inputs over trusted local networks and WireGuard-connected paths. These are not meant to be public internet-facing ports. If you know you will never use them, close them and keep the surface area tighter.
Step 6: Start the Stack
cd /opt/stacks/graylog

# Start. OpenSearch takes 30–60 seconds before Graylog can connect
docker compose up -d

# Watch OpenSearch first
docker compose logs -f graylog-opensearch

# Once you see "started" in OpenSearch, watch Graylog
docker compose logs -f graylog

# You're ready when you see:
# Graylog server up and running.
If you prefer managing the same Compose stack from a UI instead of living in the shell, Dockhand is a clean option. I still keep the raw docker compose flow in the post because it is easier to troubleshoot, easier to move, and does not depend on one more layer being healthy.
Hit http://<your-vm-ip>:9000, then log in with admin and the password you hashed in Step 4.
Step 7: Configure Graylog Inputs
Graylog doesn’t collect anything until you configure Inputs. This is the most common “where are my logs?” moment for first-timers. There is no default collection. It just sits there waiting.
Navigate to System → Inputs → Launch new input.
Input 1: Syslog TCP (fleet-wide rsyslog)
| Field | Value |
|---|---|
| Type | Syslog TCP |
| Port | 5140 |
| Bind address | 0.0.0.0 |
| Name | Fleet Syslog TCP |
Input 2: GELF UDP (Docker containers)
| Field | Value |
|---|---|
| Type | GELF UDP |
| Port | 12201 |
| Bind address | 0.0.0.0 |
| Name | Docker GELF |
Graylog 7.x gotcha: New inputs start in “Setup mode” and won’t receive logs until you explicitly activate them. After creating each input, go to More actions → Exit Setup mode → Start input. You’ll see the green “Running” indicator when it’s actually live. I spent longer than I’d like to admit wondering why nothing was showing up before I found this.
Step 8: Fleet-Wide rsyslog Forwarding via Ansible
For a fleet of 10+ nodes, configure forwarding with Ansible rather than SSH-ing into each host individually.
On most of my hosts, this is all the file needs to be. Nothing fancy. Just point the node at the Graylog box and ship everything over TCP.
Generic host config: /etc/rsyslog.d/99-graylog.conf
*.* @@192.168.70.22:5140;RSYSLOG_SyslogProtocol23Format
In my lab, 192.168.70.22 is the host where the Graylog stack is running in Docker. On another network, change that IP to wherever your Graylog syslog TCP input is listening.
That one line is enough for the majority of Ubuntu, Debian, and similar Linux hosts.
If you are following along in your own lab, this is the one value you are most likely to change in the whole post. Keep the port and format unless you intentionally built your input differently.
If you want the same file created by hand:
sudo tee /etc/rsyslog.d/99-graylog.conf > /dev/null << 'EOF'
*.* @@192.168.70.22:5140;RSYSLOG_SyslogProtocol23Format
EOF

sudo systemctl restart rsyslog
I stick with TCP here for a reason. It keeps the source IP intact when Graylog is behind Docker, which saves a lot of confusion later.
Ansible playbook: rsyslog-graylog.yml
---
- name: Configure rsyslog forwarding to Graylog
  hosts: standard_nodes   # exclude proxmox and pfsense, handled separately below
  become: true
  tasks:

    - name: Install rsyslog
      ansible.builtin.apt:
        name: rsyslog
        state: present
        update_cache: yes

    - name: Deploy Graylog forwarding config
      ansible.builtin.copy:
        dest: /etc/rsyslog.d/99-graylog.conf
        content: |
          *.* @@192.168.70.22:5140;RSYSLOG_SyslogProtocol23Format
        owner: root
        group: root
        mode: '0644'
      notify: Restart rsyslog

  handlers:
    - name: Restart rsyslog
      ansible.builtin.systemd:
        name: rsyslog
        state: restarted
        enabled: true
Run it:
ansible-playbook rsyslog-graylog.yml -i hosts.ini

# Test from any node
logger -n 192.168.70.22 -P 5140 -T --rfc5424 "test from $(hostname)"
Check Graylog’s Search tab. The test message should appear within a few seconds.
Step 9: Special Cases
Proxmox Host
Proxmox uses systemd-journald only. There is no rsyslog.service running by default, and you cannot just systemctl restart rsyslog. Install it manually:
ssh root@your-proxmox-host

apt-get install -y rsyslog
cat > /etc/rsyslog.d/99-graylog.conf << 'EOF'
*.* @@192.168.70.22:5140;RSYSLOG_SyslogProtocol23Format
EOF
systemctl enable rsyslog && systemctl start rsyslog
You’ll see Proxmox VM start/stop events, storage operations, cluster activity, and PVE daemon logs flowing in under source: your-proxmox-hostname.
pfSense / OPNsense → Graylog
pfSense has a built-in syslog forwarder. No SSH required.
Same idea here: use the IP of your Graylog host, not mine.
Navigate to Status → System Logs → Settings:
| Field | Value |
|---|---|
| Enable Remote Logging | ✅ |
| Remote Log Servers | 192.168.70.22:5140 |
| Remote Syslog Contents | Everything (or select specific facilities) |
Save and apply. Firewall events, DHCP leases, and IDS alerts appear in Graylog immediately.
pfSense → Synology NAS (Local Log Archive)
If you want pfSense logs written directly to disk on a Synology NAS, independent of Graylog, you can run rsyslog on the Synology and have pfSense forward there instead, or in addition.
On the Synology NAS:
Enable SSH in Control Panel → Terminal & SNMP, then:
ssh admin@your-synology-ip

# Create log directory
mkdir -p /volume1/logs/pfsense

# Create rsyslog config
sudo tee /etc/rsyslog.d/pfsense.conf << 'EOF'
# Receive syslog from pfSense on UDP 514
$ModLoad imudp
$UDPServerRun 514

# Write pfSense logs to dedicated file
if $fromhost-ip == '10.0.0.1' then /volume1/logs/pfsense/pfsense.log
& stop
EOF

sudo synoservicectl --restart rsyslogd
On pfSense:
Navigate to Status → System Logs → Settings:
| Field | Value |
|---|---|
| Enable Remote Logging | ✅ |
| Remote Log Servers | your-synology-ip:514 |
| Remote Syslog Contents | Firewall Events, General System, DHCP |
pfSense log visibility via its own UI is already solid. Firewall rules, DHCP leases, and IDS events are all browsable natively. The Synology archive is purely for retention and offline reference. If you later want to pull these into Graylog, you can add a second remote log server entry in pfSense pointing at your Graylog instance and run both simultaneously. No rsyslog changes are needed on the NAS.
Docker Containers (GELF)
Add the logging driver to any compose service to forward container logs directly to Graylog:
services:
  your-app:
    image: your-image
    logging:
      driver: gelf
      options:
        gelf-address: "udp://10.0.0.x:12201"
        tag: "your-app-name"
Requires the GELF UDP Input to be running (Step 7). Point gelf-address at the host where your Graylog stack is listening for GELF, not just the container name. Use meaningful tag values. They become searchable fields in Graylog and make filtering across containers much cleaner.
Remote Nodes (VPS over WireGuard)
For VPS nodes with site-to-site WireGuard access back to your lab, rsyslog forwarding works identically. Just point at the Graylog VM’s lab IP through the tunnel:
sudo tee /etc/rsyslog.d/99-graylog.conf > /dev/null << 'EOF'
*.* @@192.168.70.22:5140;RSYSLOG_SyslogProtocol23Format
EOF
sudo systemctl restart rsyslog
No special configuration needed as long as WireGuard is routing your lab subnet through the tunnel.
Step 10: Reverse Proxy (Nginx Proxy Manager)
Expose the Graylog UI through NPM:
| Field | Value |
|---|---|
| Domain | logs.domain.cloud |
| Scheme | http |
| Forward Hostname/IP | your Graylog VM IP |
| Forward Port | 9000 |
| Websockets Support | ✅ |
| SSL Certificate | *.lab.yourdomain.com wildcard |
| Force SSL | ✅ |
Websockets required: Graylog’s UI uses websockets for live log streaming. Don’t skip that toggle or the search stream view will silently not work.
The domain, upstream IP, and cert here all need to match your own environment. If the browser URL and
GRAYLOG_HTTP_EXTERNAL_URIdisagree, expect strange behavior.
Step 11: Index Retention Tuning
Out of the box, OpenSearch’s default index set is ~4GB per index with no retention limit. Set this before your NAS fills up.
System → Indices → Default index set → Edit
| NAS allocation | Max indices |
|---|---|
| ~40GB | 10 |
| ~80GB | 20 |
| ~200GB | 50 |
Set Rotation strategy to Index Size at 4GB and Retention strategy to Delete with your max index count. Graylog handles the rest automatically.
Optional: Grafana Visibility
Once Graylog is actually taking traffic, I like to keep two Grafana views handy. One tells me whether the stack itself is calm or about to get weird. The other tells me what the logs are actually doing across the lab. Between the two, I can usually tell pretty fast whether I have a Graylog problem, a host problem, or just one noisy box being dramatic again.
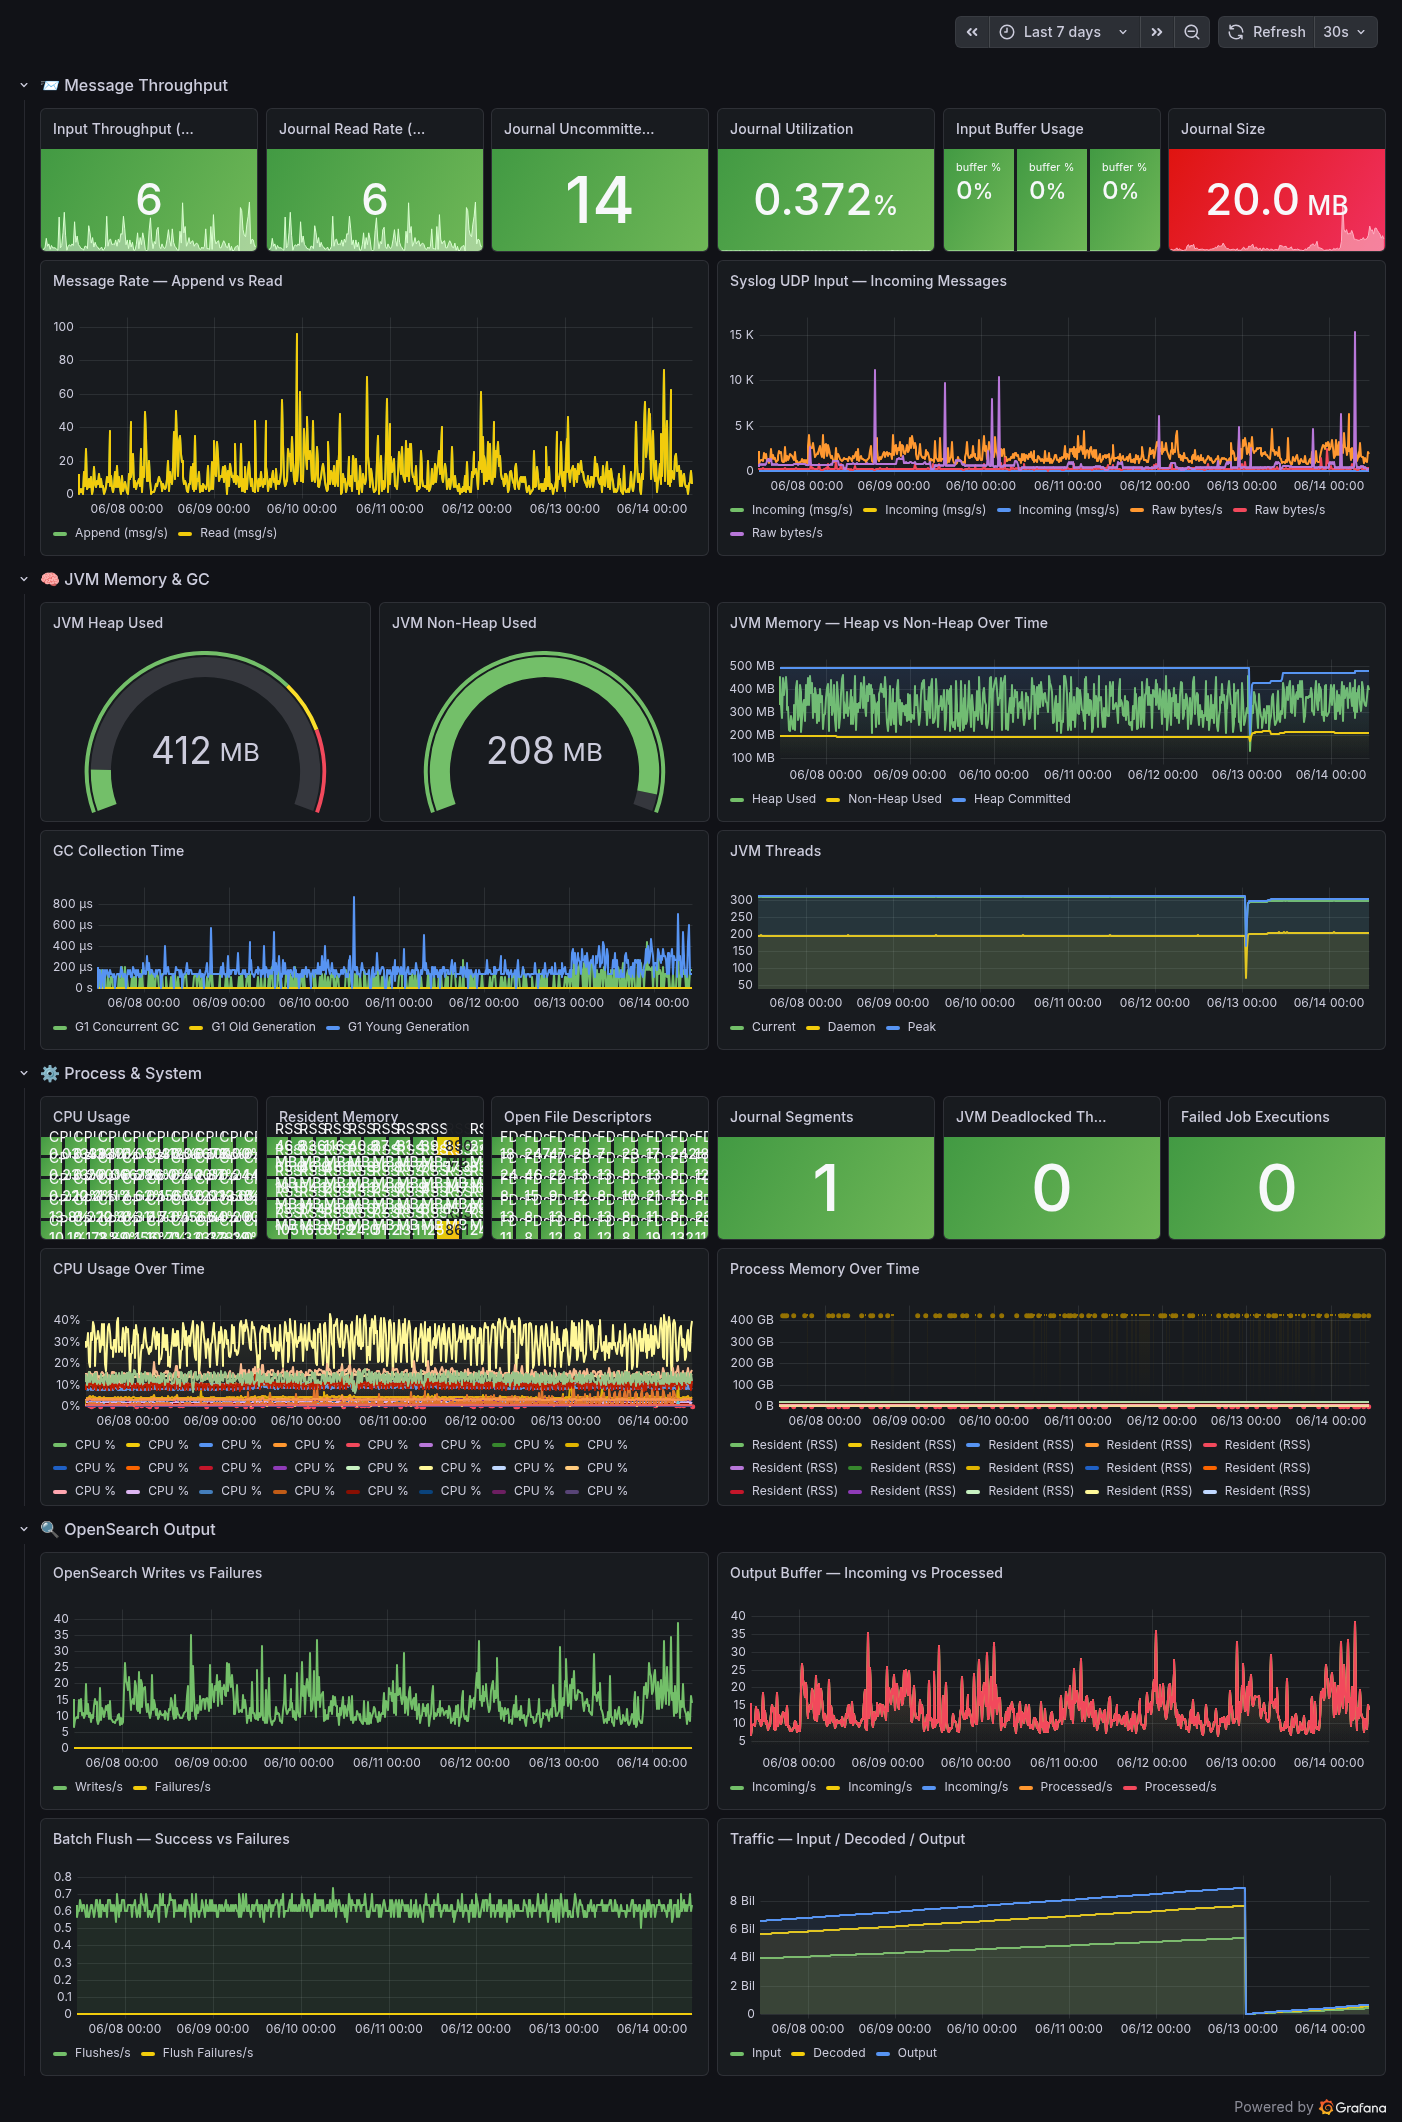
Example Grafana view built from Graylog’s built-in Prometheus exporter, tracking message throughput, journal usage, JVM behavior, and OpenSearch output health.
Graylog documents the built-in Prometheus exporter here: Operational Metrics. That is the real source I would trust first. If you want a public Grafana starting point, the community dashboard 9122 - Graylog is worth looking at for ideas, but I would treat it as inspiration and not a hard dependency.
I also keep a separate Grafana dashboard that is less about Graylog the service and more about the actual logs moving through the lab. That one gives me a faster read on message volume, noisy hosts, pfSense chatter, auth failures, and whether something in the fleet has decided to start screaming into the void.
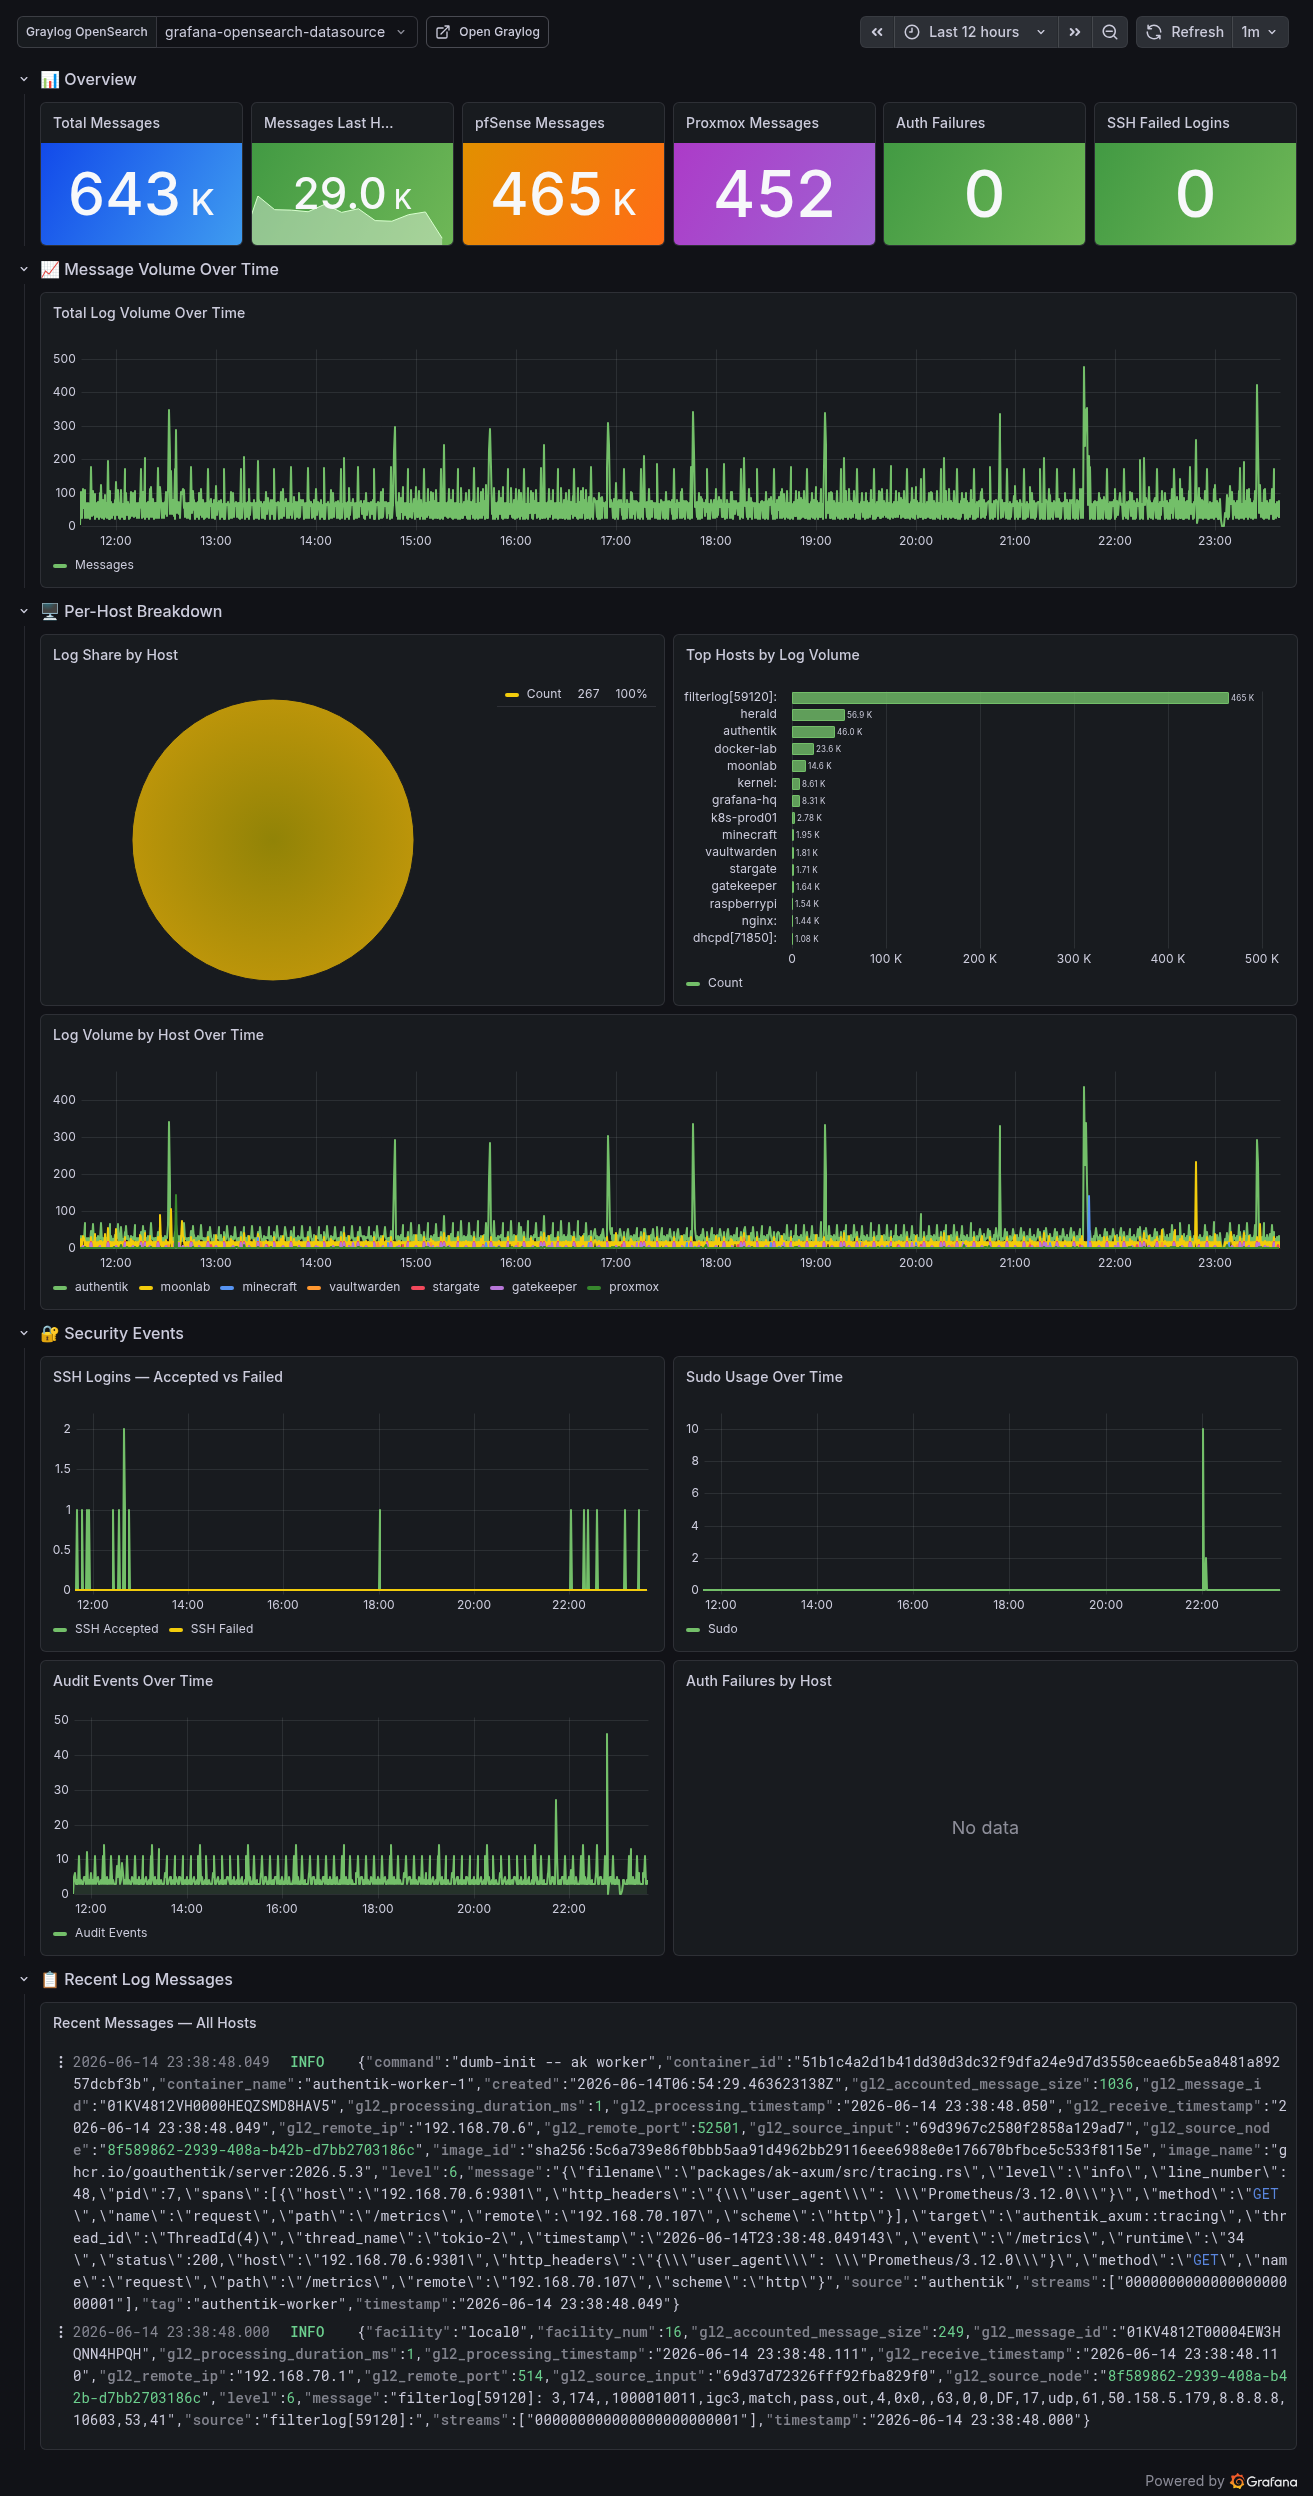
Custom Graylog analytics dashboard focused on log volume, host breakdown, recent messages, and the kinds of security-ish events that make you stop what you are doing and look closer.
If you want to use the dashboard and tune it to your own environment, I exported the JSON here: graylog-log-analytics-dashboard.json. Import it into Grafana, swap in your own datasource, then adjust panel queries to match your field names and whatever weirdness your lab specializes in.
Useful Commands
# Start the stack
cd /opt/stacks/graylog && docker compose up -d

# Stop the stack
docker compose down

# Restart only Graylog (e.g. after .env change)
docker compose up -d graylog

# Tail logs per container
docker compose logs -f graylog
docker compose logs -f graylog-opensearch
docker compose logs -f graylog-mongodb

# Check container status
docker compose ps

# Send a manual test syslog message
logger -n 10.0.0.x -P 5140 -T --rfc5424 "test from $(hostname)"

# Check vm.max_map_count (must be ≥ 262144)
cat /proc/sys/vm/max_map_count

# Check NFS mount health
df -h | grep graylog
Fleet Coverage Reference
| Source | Method | Notes |
|---|---|---|
| Standard Linux nodes | rsyslog via Ansible | TCP, RFC5424 format |
| Proxmox host | rsyslog manual install | journald only by default, install rsyslog first |
| pfSense / OPNsense | Native syslog UI | Built-in forwarder, no packages needed |
| pfSense → Synology NAS | rsyslog on NAS, UDP 514 | Local disk archive, independent of Graylog |
| Docker containers | GELF logging driver | Per-service, tag everything |
| VPS nodes | rsyslog via WireGuard tunnel | Routes through site-to-site WG |
Troubleshooting
Graylog won’t start / can’t connect to OpenSearch
OpenSearch takes 30–60 seconds to be ready. Watch docker compose logs -f graylog-opensearch and wait for the “started” line before expecting Graylog to come up. Patience.
Logs not appearing after configuring rsyslog Check that the Input is in Running state, not Setup mode. In Graylog 7.x, new inputs require an explicit “Exit Setup mode → Start input” step. This is not obvious and not well documented.
MongoDB crash loop on startup
You’ve pointed MongoDB at an NFS mount. Move it to a local named volume. MongoDB’s entrypoint chown is blocked by NFS root squashing. See the compose file in Step 5.
rsyslog not found on Proxmox
Proxmox ships without rsyslog. It uses journald only. apt-get install rsyslog and then enable it. Don’t bother looking for rsyslog.service before installing it.
AppArmor blocking rsyslog journal access
If rsyslog starts but produces no output on a specific host, AppArmor may be blocking /var/log/journal access. Check journalctl -xe | grep apparmor. Fix is either an AppArmor exception for rsyslogd or disabling it on that host if it’s not a security boundary you care about.
Source IPs all showing as the Docker host IP
You’re using UDP syslog (@ in rsyslog). Switch to TCP (@@). UDP loses source IPs through Docker’s bridge NAT, so every log entry will look like it came from the same host. TCP fixes this.
Graylog 7.1.x UI suddenly throws content stream errors everywhere
If you upgraded into 7.1.x and the web UI starts spraying Could not load content stream errors, failing dashboards, or repeated HTTP 400 responses tied to Enterprise-only content stream endpoints, back out and pin 7.0.6 for now. That was the clean answer in my lab.
Graylog downgrade back to 7.0.6 will not start after testing 7.1.3
Check the MongoDB sessions index. In my case, dropping db.sessions.dropIndex("session_id_1") let 7.0.6 start and recreate what it needed. This is exactly the kind of upgrade path that reminds you to pin versions and back up MongoDB before touching anything.
Production Notes
This stack is sized for a lab with 10–15 nodes. For a production deployment:
- Multi-node OpenSearch cluster for redundancy and index parallelism
- Graylog Operations or Security tier for built-in alerting, threat intel feeds, and compliance dashboards
- mTLS on syslog inputs: plaintext TCP is fine on an isolated lab VLAN, not fine for anything crossing untrusted networks
- Dedicated journal disk separate from OpenSearch data: high ingestion rates cause I/O contention on shared storage
- Back up MongoDB: it’s small, but losing it means rebuilding every dashboard, input, and stream rule from scratch
What’s Next
With centralized logging running, the natural extensions are:
- Streams: route logs by source or facility into separate views (firewall, auth, container logs)
- Pipelines: enrich fields in real time (GeoIP on source IPs, severity normalization)
- Alerts: fire on failed SSH attempts, service crashes, or custom patterns
- Grafana integration: Graylog exposes Prometheus metrics on
:9833; scrape it and overlay log volume on top of your existing dashboards
Running this in your lab? Hit me on the socials or drop a comment. If something in this guide is wrong or outdated for your version of Graylog, let me know. I’d rather fix it than leave someone debugging in circles.
Comments
Questions, corrections, and follow-ups live in GitHub Discussions.