I have two Brother printers on my network. A MFC-L3770CDW color laser all-in-one and an HL-L2340D mono laser, both sitting on the IoT VLAN, both capable of ethernet and wireless, both discoverable over Bonjour and Avahi. They are managed through CUPS on a dedicated print server node and until recently were completely invisible to my monitoring stack. No metrics. No job queue visibility. No way to know if the CUPS scheduler had silently died other than actually trying to print something and watching it fail.
I went looking for a Prometheus exporter for CUPS. The kind that would give me printer state, active jobs, completed job counts — the fundamentals. What I found was either abandoned, overly complex, or simply did not exist in a form I could drop into a Compose stack without significant rework. So I wrote one.
The result is cups-prometheus-exporter
— a lightweight Python exporter that talks to CUPS via the Unix socket, exposes
metrics on port 9628, and runs as a Docker container alongside your print server.
No credentials. No network configuration. No separate daemon to manage. Just metrics.
Why This Needed to Exist
CUPS is everywhere in homelabs and small offices. It is the standard Linux print server, manages physical printers over USB and the network, and has been the default on most distros for years. In my setup both printers live on a dedicated IoT VLAN, isolated from the main network the way anything with a firmware updater and a web UI should be. They are reachable from the print server via ethernet and announce themselves over Bonjour and Avahi for wireless clients that need to discover them. CUPS sits in between, brokering all of it. Despite how common this setup is, the observability story around CUPS is essentially nonexistent if you are running a Prometheus and Grafana stack.
The standard exporters cover the things you expect: node metrics, Docker container metrics, application-level HTTP metrics. What nobody had built cleanly was something that would tell you whether your print server scheduler was actually running, whether the printer was accepting jobs, how deep the queue was, and how many jobs had completed since the last restart. Those are the questions you want answered when someone walks up to you and says the printer is not working.
This exporter answers them.
How the Exporter Works
The exporter is a Python script that runs inside a Docker container. It mounts
the CUPS Unix socket at /var/run/cups/cups.sock read-only, which gives it
direct access to the running CUPS scheduler on the host without needing to open
any network ports or configure any credentials.
On each scrape, it calls lpstat from the cups-client package and parses the
output to determine printer state, job counts, and scheduler health. The results
are formatted as Prometheus metrics and served over a simple HTTP handler on
port 9628. When Prometheus scrapes that endpoint, it gets clean, labeled output
ready for Grafana.
The lpstat approach means the exporter works with any CUPS installation
regardless of version or configuration. It talks to CUPS the same way any other
client on the system would.
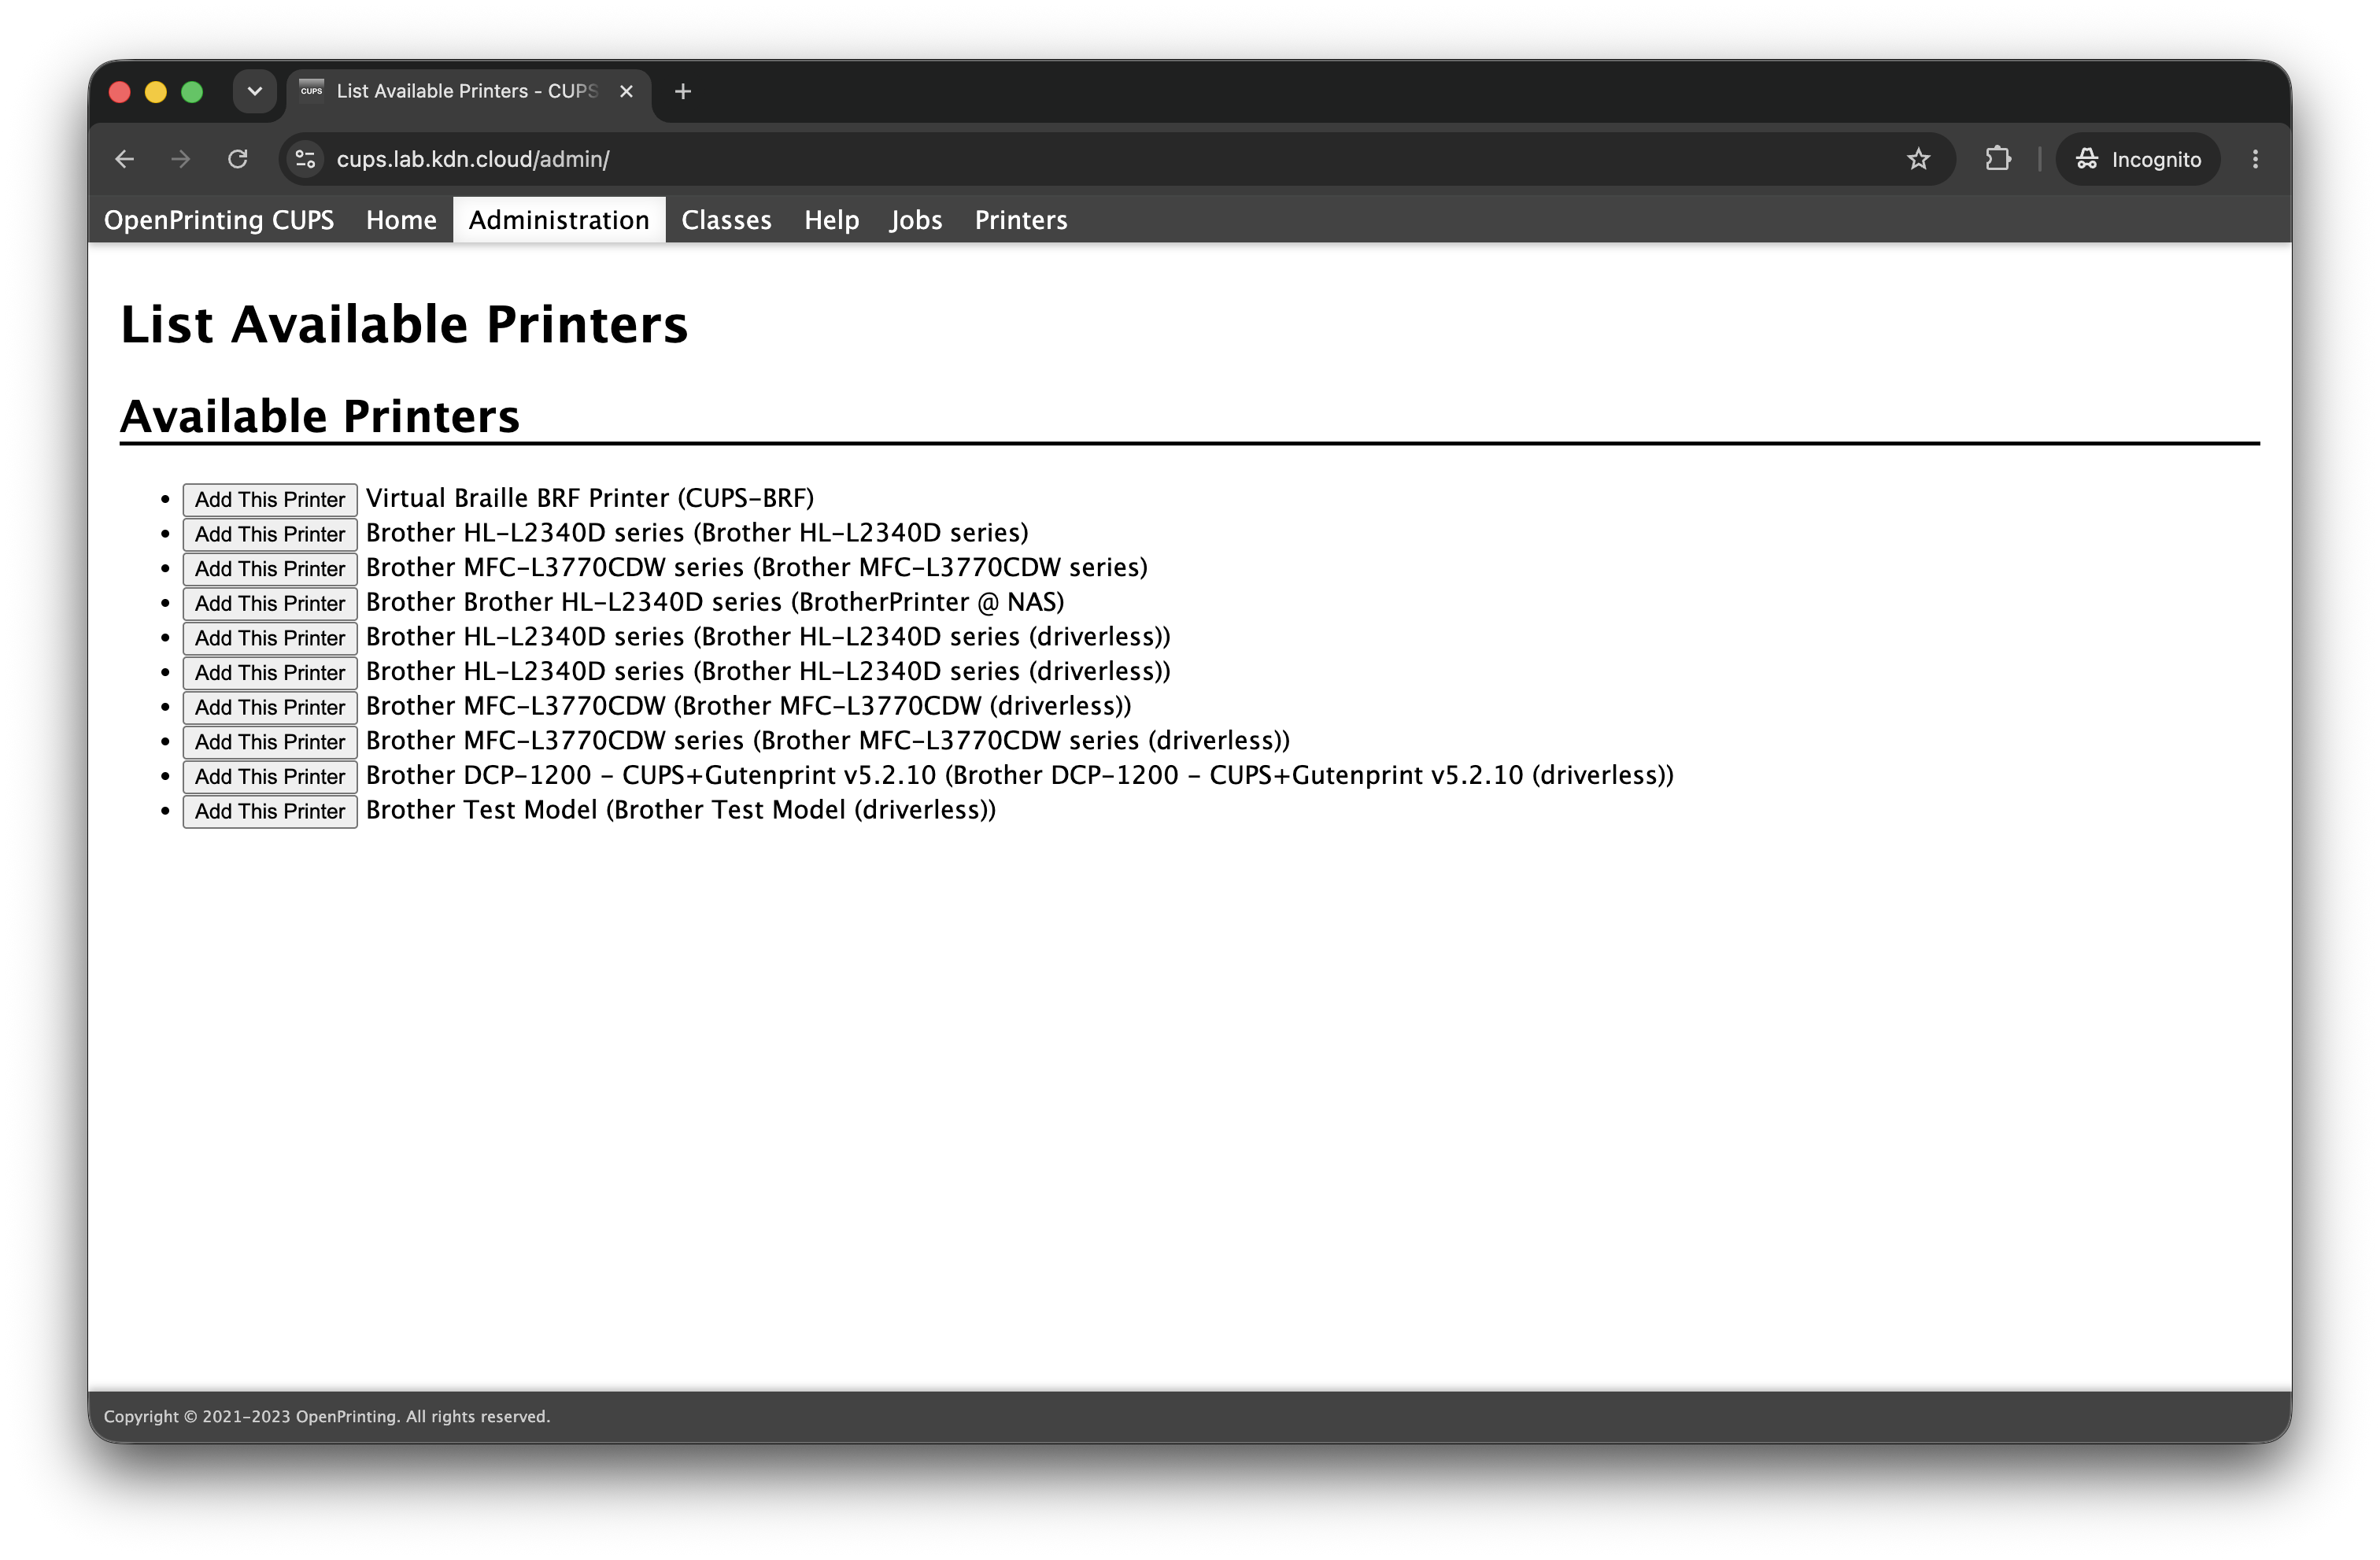
Here is what the CUPS admin interface looks like when discovering available printers. Both Brother devices show up as driverless IPP Everywhere entries alongside anything else CUPS can see on the network:
What It Exposes
Six metrics. Deliberately minimal. Every metric that matters for knowing whether your print server is healthy and your printers are functional, nothing beyond that.
| Metric | Type | Description |
|---|---|---|
cups_up |
gauge | CUPS scheduler is reachable (0/1) |
cups_printer_status |
gauge | Printer state: 0=idle, 1=printing, 2=stopped/error |
cups_printer_accepting |
gauge | Printer is accepting jobs (0/1) |
cups_printer_enabled |
gauge | Printer is enabled (0/1) |
cups_jobs_active |
gauge | Active/pending jobs per printer |
cups_jobs_completed |
counter | Completed jobs per printer since CUPS start |
Every per-printer metric includes a printer label with the printer name. In
Grafana you are querying cups_printer_status{printer="Brother-MFC-L3770CDW"}
rather than guessing at an index. Both of mine show up automatically with their
own labels: the MFC-L3770CDW and the HL-L2340D, each sitting on the IoT VLAN,
each capable of ethernet and wireless, each discoverable via Bonjour and Avahi,
each reporting their own state independently. Register another printer in CUPS
tomorrow and it appears in the next scrape without touching the exporter.
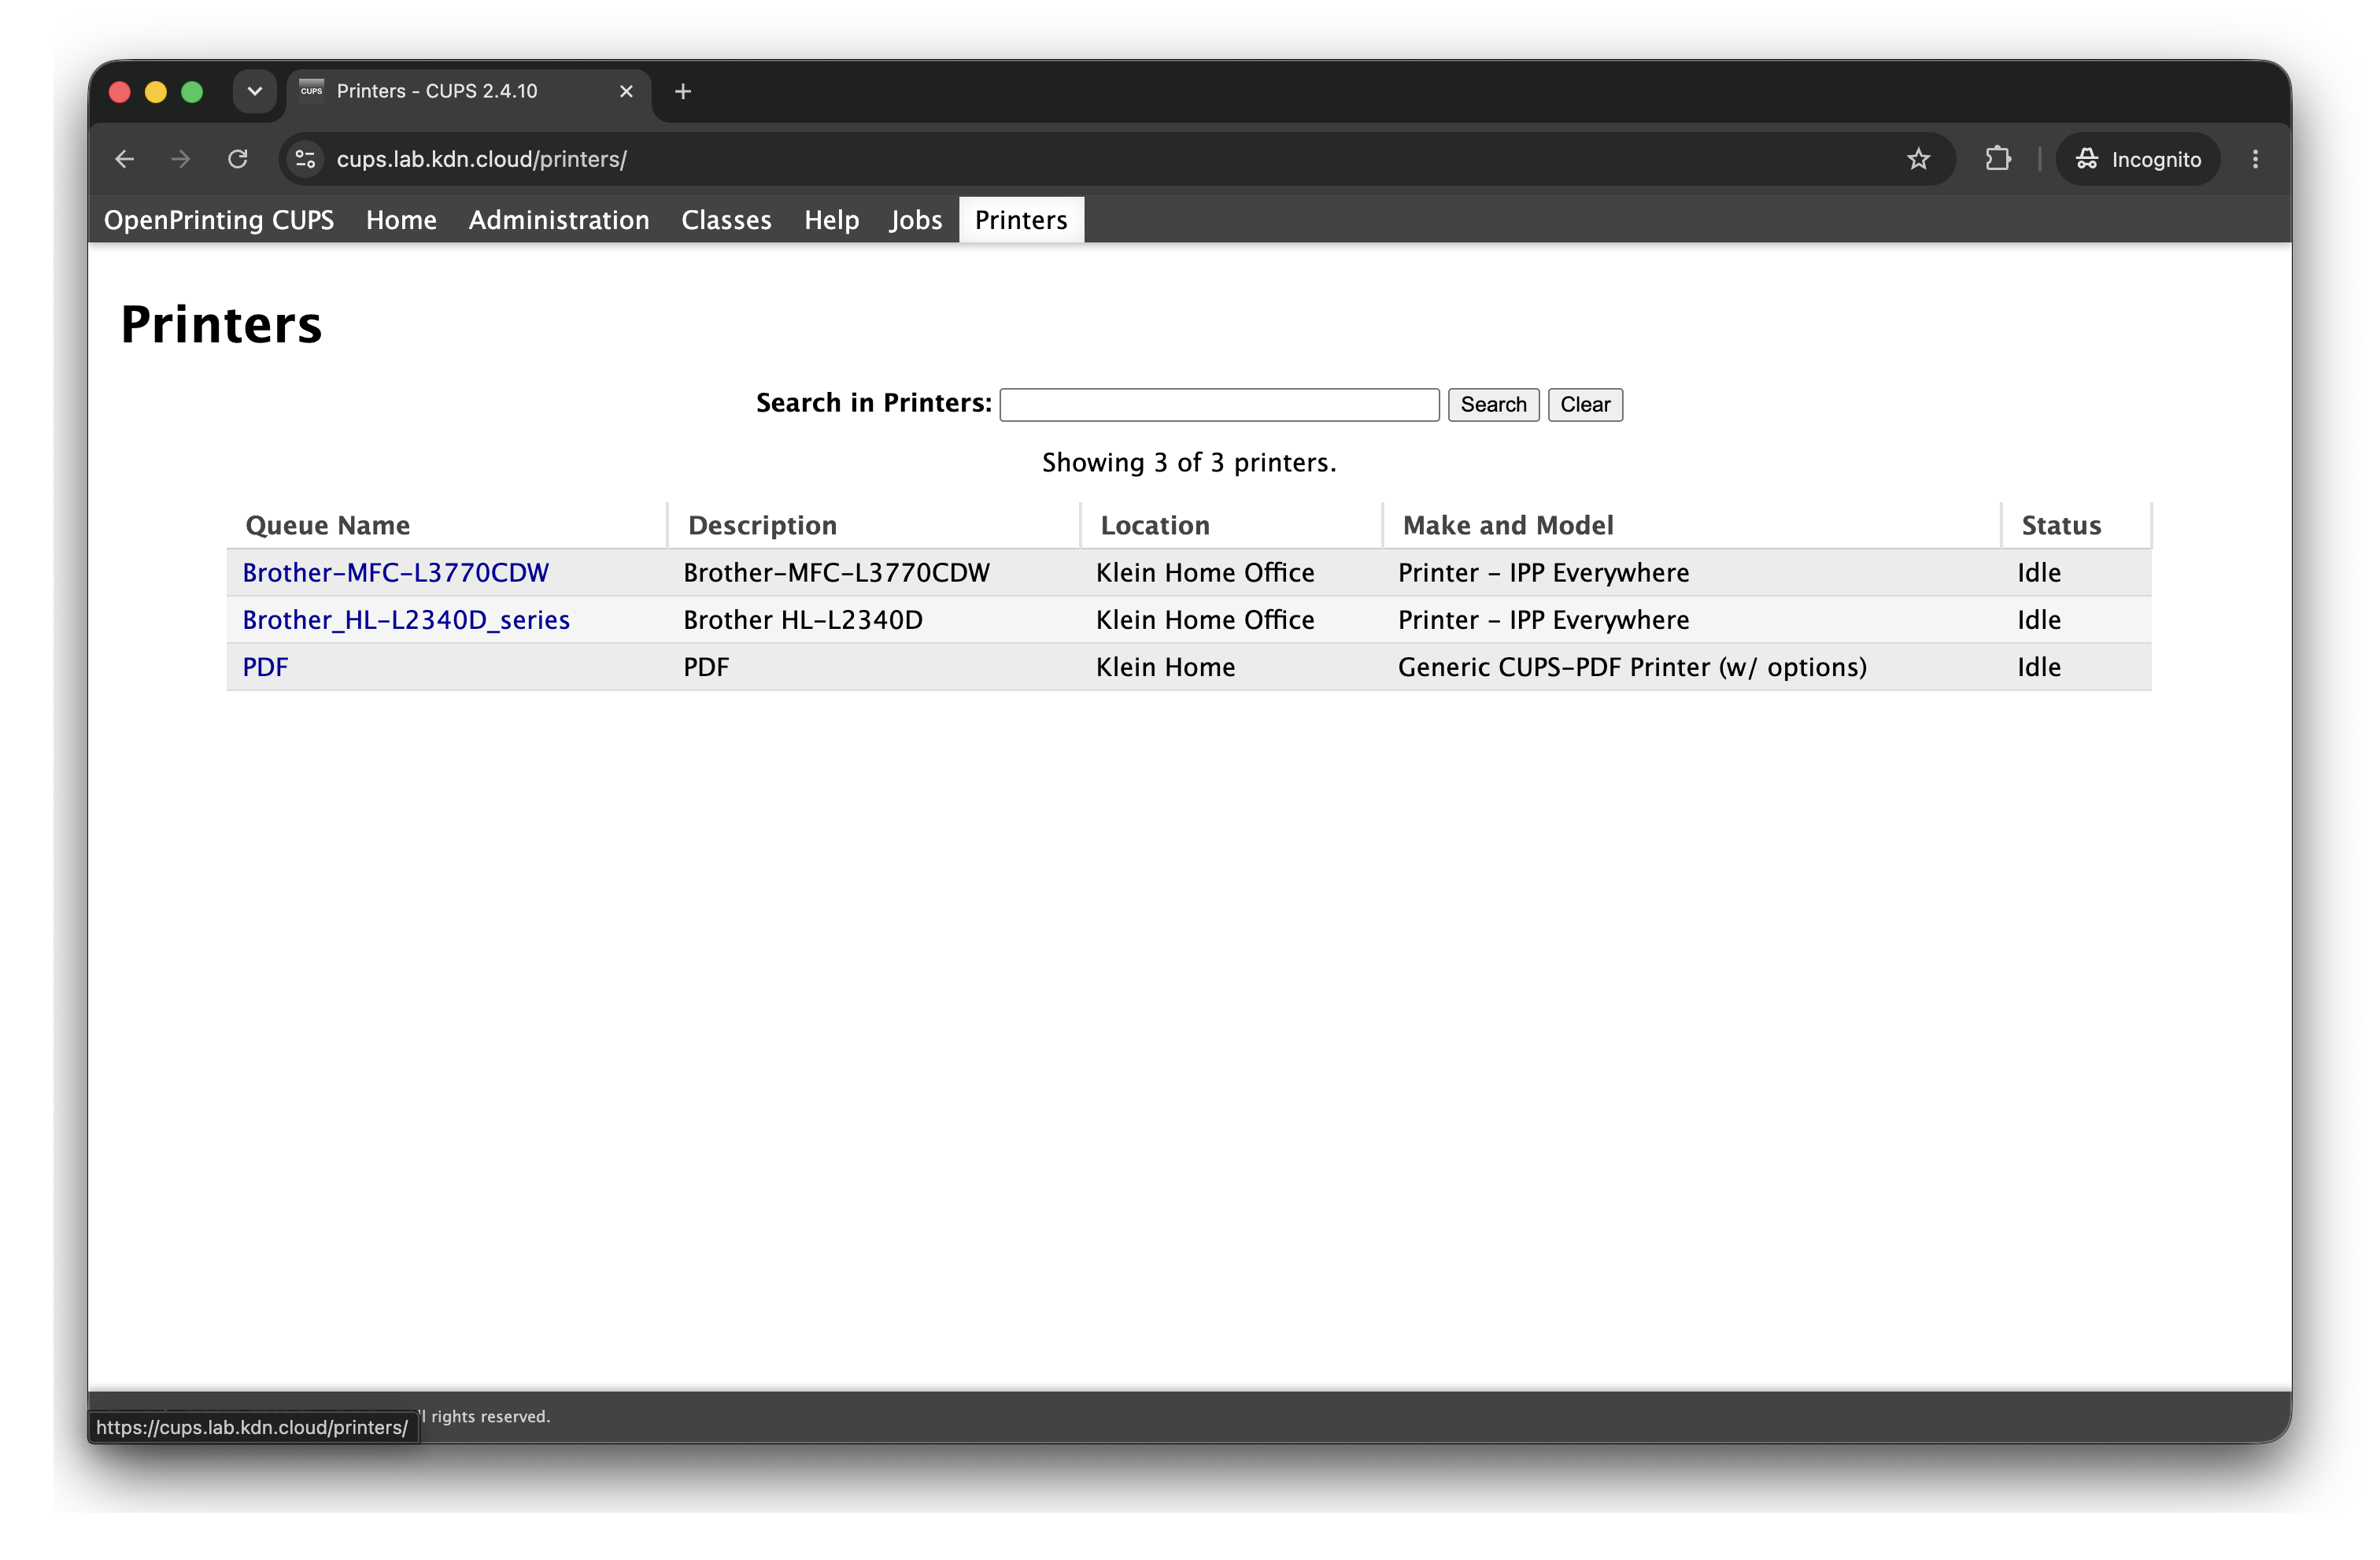
Once added, both printers are managed cleanly through the main CUPS printers view. In my case they are idle, reachable, and configured with driverless IPP Everywhere support:
Verifying the Exporter Is Working
Once the container is running, a quick curl confirms the metrics endpoint is up and returning data:
curl http://localhost:9628/metrics
You should see output along these lines:
# HELP cups_up Whether the CUPS scheduler is running
# TYPE cups_up gauge
cups_up 1
# HELP cups_printer_status Printer state: 0=idle, 1=printing, 2=stopped
# TYPE cups_printer_status gauge
cups_printer_status{printer="Brother-MFC-L3770CDW"} 0
cups_printer_status{printer="Brother-HL-L2340D"} 0
# HELP cups_printer_accepting Whether the printer is accepting jobs
# TYPE cups_printer_accepting gauge
cups_printer_accepting{printer="Brother-MFC-L3770CDW"} 1
cups_printer_accepting{printer="Brother-HL-L2340D"} 1
# HELP cups_printer_enabled Whether the printer is enabled
# TYPE cups_printer_enabled gauge
cups_printer_enabled{printer="Brother-MFC-L3770CDW"} 1
cups_printer_enabled{printer="Brother-HL-L2340D"} 1
# HELP cups_jobs_active Number of active or pending jobs
# TYPE cups_jobs_active gauge
cups_jobs_active{printer="Brother-MFC-L3770CDW"} 0
cups_jobs_active{printer="Brother-HL-L2340D"} 0
# HELP cups_jobs_completed Total completed jobs since CUPS start
# TYPE cups_jobs_completed counter
cups_jobs_completed{printer="Brother-MFC-L3770CDW"} 14
cups_jobs_completed{printer="Brother-HL-L2340D"} 7
If cups_up returns 1 and you see your printer name in the labels, everything
is wired up correctly.
Docker Support and GHCR
The image is published to GitHub Container Registry under the variablenix
namespace and is publicly available. Pulling it requires no authentication:
docker pull ghcr.io/variablenix/cups-prometheus-exporter:latest
The full Compose service definition using the GHCR image:
cups-exporter:
  image: ghcr.io/variablenix/cups-prometheus-exporter:latest
  container_name: cups-exporter
  restart: unless-stopped
  environment:
    - CUPS_SERVER=/var/run/cups/cups.sock
  volumes:
    - /var/run/cups/cups.sock:/var/run/cups/cups.sock:ro
  network_mode: host
  healthcheck:
    test: ["CMD", "curl", "-f", "http://localhost:9628/metrics"]
    interval: 30s
    timeout: 5s
    retries: 3
    start_period: 10s
network_mode: host is required so the container can reach the CUPS socket and
expose metrics on the host network interface. Docker will warn you that the
ports: directive has no effect in host network mode, which is expected. Leave
ports: out of the service definition entirely and the warning goes away.
The full docker-compose.yml in the repo also includes node-exporter and
cadvisor for host and container metrics. Include or drop those based on what
your stack already covers.
Building Locally
If you prefer to build the image yourself rather than pulling from GHCR, clone the repo and build:
git clone https://github.com/variablenix/cups-prometheus-exporter.git
cd cups-prometheus-exporter
docker compose build cups-exporter
docker compose up -d cups-exporter
When building locally, update the image: line in your Compose file to use a
local tag and add the build: block:
cups-exporter:
  build:
    context: .
    dockerfile: Dockerfile
  image: cups-exporter:local
I build new images on the CUPS host itself to keep architecture compatibility
clean. The print server runs x64 and building natively on the target host avoids
any cross-compilation concerns. The build-and-publish.sh script in the repo
handles GHCR authentication, the Docker build, and the push in a single run.
The Dockerfile
The image is built from python:3.12-slim and installs two packages:
cups-client for lpstat access and curl for the Docker healthcheck.
FROM python:3.12-slim

RUN apt-get update -qq && \
    apt-get install -y -qq --no-install-recommends \
    cups-client \
    curl && \
    rm -rf /var/lib/apt/lists/*

COPY cups_exporter.py /app/cups_exporter.py

EXPOSE 9628
CMD ["python3", "/app/cups_exporter.py", "--port", "9628"]
The image is intentionally minimal. No framework overhead, no extra dependencies, nothing that is not directly required for the exporter to function.
Updating When You Deploy via GHCR
If you are using the GHCR image and want to pull a new version after an update, the process is straightforward:
docker compose pull cups-exporter
docker compose up -d cups-exporter
If you built locally and made changes to cups_exporter.py or the Dockerfile,
remove the container first and rebuild:
docker rm -f cups-exporter
docker compose build cups-exporter
docker compose up -d cups-exporter
Prometheus Scrape Configuration
Add this job to your prometheus.yml scrape config:
scrape_configs:
  - job_name: 'cups-exporter'
    scrape_interval: 30s
    metrics_path: /metrics
    static_configs:
      - targets: ['192.168.70.10:9628']
        labels:
          role: 'print-server'
          use: 'cups'
          hostname: 'cups-print'
Replace 192.168.70.10 with the IP of your CUPS host. If Prometheus is running
on the same machine as the exporter, use localhost:9628 as the target.
The role, use, and hostname labels are optional but useful for filtering
in Grafana when you have multiple exporters running across the fleet.
The Completed Job History Gotcha
By default CUPS does not retain completed job history. This means
cups_jobs_completed will always return 0, which makes the counter useless for
tracking print volume over time.
To enable job history retention, add the following to /etc/cups/cupsd.conf:
MaxJobs 500
PreserveJobHistory Yes
PreserveJobFiles No
Then restart CUPS:
sudo systemctl restart cups
PreserveJobHistory Yes keeps the job records in memory. PreserveJobFiles No
means CUPS does not keep the actual print data on disk, just the metadata. This
gives you job count history without consuming significant storage. MaxJobs 500
caps how many completed records CUPS holds before rotating old ones out.
Without this change, the completed job counter in Grafana will sit at zero permanently and you will spend time wondering if the exporter is broken. It is not. CUPS just does not keep the records by default.
Changing the Default Port
The exporter listens on port 9628 by default. If that conflicts with something
else on your host, override it in docker-compose.yml:
command: ["python3", "/app/cups_exporter.py", "--port", "9999"]
Update your Prometheus scrape target to match the new port.
The Grafana Dashboard
Once metrics are flowing into Prometheus, Grafana picks them up on the next
scrape cycle. The screenshot at the top of the repo shows the dashboard I built
for my own setup. It covers scheduler health via cups_up, printer state with
color coding for idle, printing, and error states, active job queue depth as a
time series, and completed job volume as a rate over the selected time window.
None of the panels require anything exotic. Standard Grafana time series and stat
panels with the metric names above and a printer label filter are all it takes.
Repository Structure
cups-prometheus-exporter/
├── cups_exporter.py       # The exporter itself
├── Dockerfile             # Builds the container image
├── docker-compose.yml     # Deploy with Docker Compose
├── build-and-publish.sh   # Build locally and push to GHCR
└── README.md
Everything you need to deploy, build, or modify the exporter is in the repo.
The build-and-publish.sh script handles the GHCR workflow: preflight auth
check, Docker build, push, and a visibility verification step that warns you
if the package is still set to private.
Contributions Welcome
The project is public on GitHub at variablenix/cups-prometheus-exporter.
If you run CUPS in your homelab or at a small office and want actual visibility into it, pull it down and try it. If something is broken or missing, open an issue. If you add something useful — additional metrics, a multi-arch build, a Grafana dashboard JSON export, Alertmanager rules for printer error states — pull requests are open and welcome.
This exists because I needed it and nothing else fit the bill. If it saves you the same search I had to do, that is the whole point.
The full repo including the Dockerfile, Compose file, exporter source, and build script is at github.com/variablenix/cups-prometheus-exporter. The image is published publicly to GHCR and free to pull with no authentication required.
Comments
Questions, corrections, and follow-ups live in GitHub Discussions.